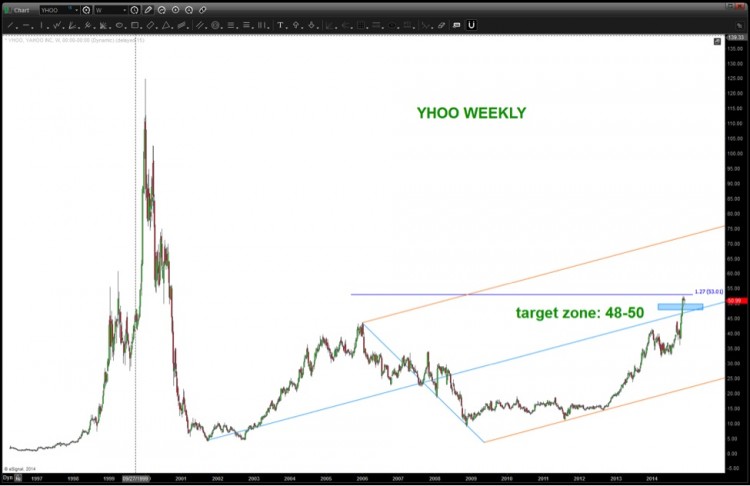
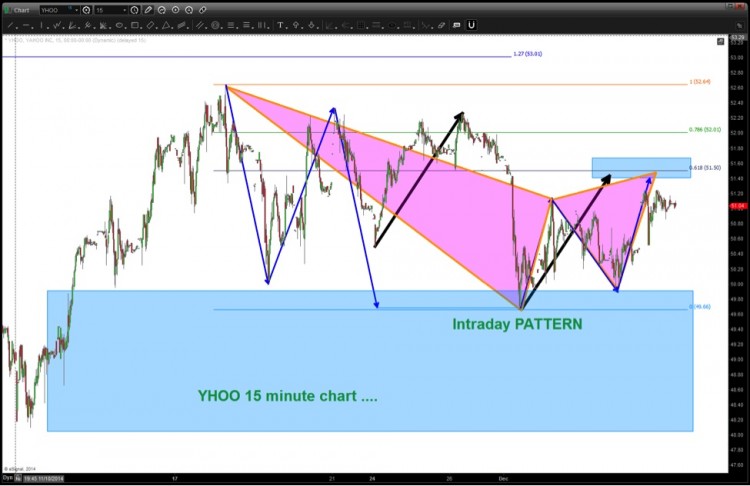
 A couple weeks back we discussed Yahoo! Inc. (YHOO – Quote) and the topping PATTERN that we saw emerging. That PATTERN has been hit and while the primary target area was 48-50, the pattern remains valid. I’d like to provide a quick update on this sell pattern and how it may play out (including fail).
We’ll need to watch this one closely, as YHOO is in the zone. Please see the charts below for reference:
- Note the thrust up into this level. It was strong…
- Also, note YHOO closed “above” the primary PATTERN level and have found support on an intraday basis. A lot of times, if a PATTERN fails, the market will come back to it and “kiss it” and then take off.
- That being said, we have one of two outcomes playing out for Yahoo stock…
- Distribution
- If Distribution, then I would look at a daily close below 48 as indicating that a top is in place.
- Accumulation
- If accumulation then 1) expect 51-52 to be taken out with a daily close above it and then the weekly 1.27 extension target to be attacked up around 53. If 53 is taken out to the upside by a daily close and with high volume then YHOO will be off and running and other patterns will come into play.
- Distribution
Let’s be patient and see how this plays out. I don’t know, nor do I care, which direction it ultimately resolves. But the topping pattern for YHOO is still in play until $53 is taken out on volume.
It’s just a pattern folks… Thanks for reading.
Yahoo YHOO Weekly Chart
Short-Term Harmonic Pattern?
Follow Bart on Twitter: @BartsCharts
No position in any of the mentioned securities at the time of publication. Any opinions expressed herein are solely those of the author, and do not in any way represent the views or opinions of any other person or entity.


