Yahoo! Inc. (NASDAQ:YHOO) has been in the news a lot over the past few years. Whether it be acquisitions, speculation about being acquired, operations, or valuation, it’s been covered.
And with the stock under pressure into 2016, the news wasn’t always cheery.
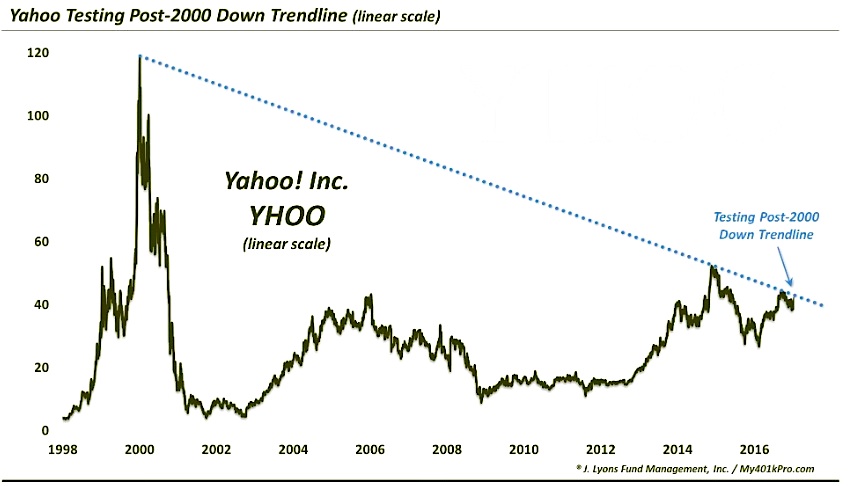
But if we look at a long-term linear chart of Yahoo stock (YHOO), we can see that shares have rallied sharply since bottoming last February. And they are now testing the downtrend line from the 2000 stock top.
It remains to be seen whether Yahoo can flip the script, so to speak.
But it is clear that this is a critical juncture for the stock. YHOO tested this downtrend line just last September and failed to breakout. Does it have the oomph this time?
Yahoo (YHOO) “Linear” Stock Chart
Thanks for reading.
Twitter: @JLyonsFundMgmt
The author does not have a position in mentioned securities at the time of publication. Any opinions expressed herein are solely those of the author, and do not in any way represent the views or opinions of any other person or entity.


