On a day to day basis I truly have NO IDEA what the fundamentals are doing. That’s because my specialty is advanced charting patterns. In short, I focus solely on the price action. One stock that I have been tracking closely (and has continued to follow price expectations) is Yahoo (YHOO).
If you’ve been following my writing, then you know I’ve been covering Yahoo stock as a technical pure play.
The technical price harmonics have been amazingly accurate thus far for YHOO, giving out important support and resistance levels for the only thing that matters – PRICE and TIME.
To follow along with the series on Yahoo stock, I recommend catching up here:
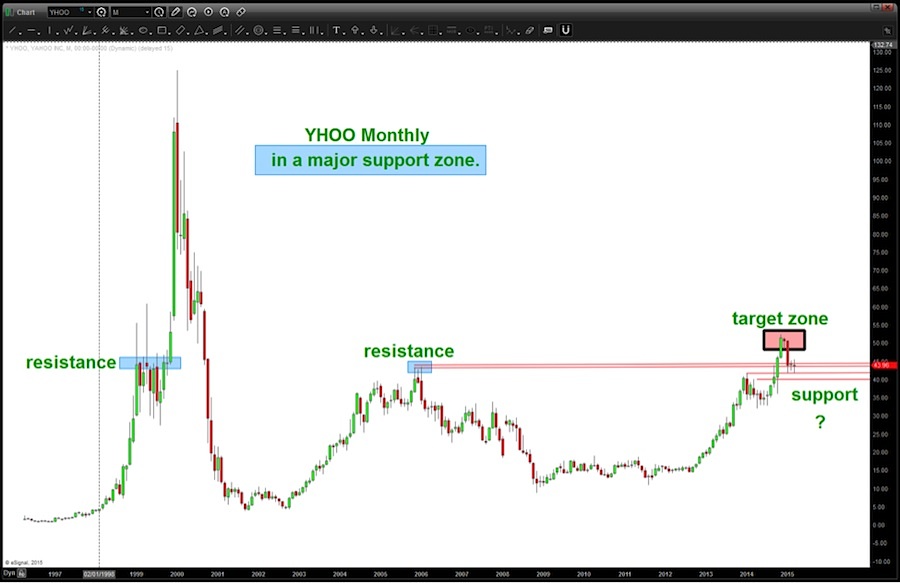
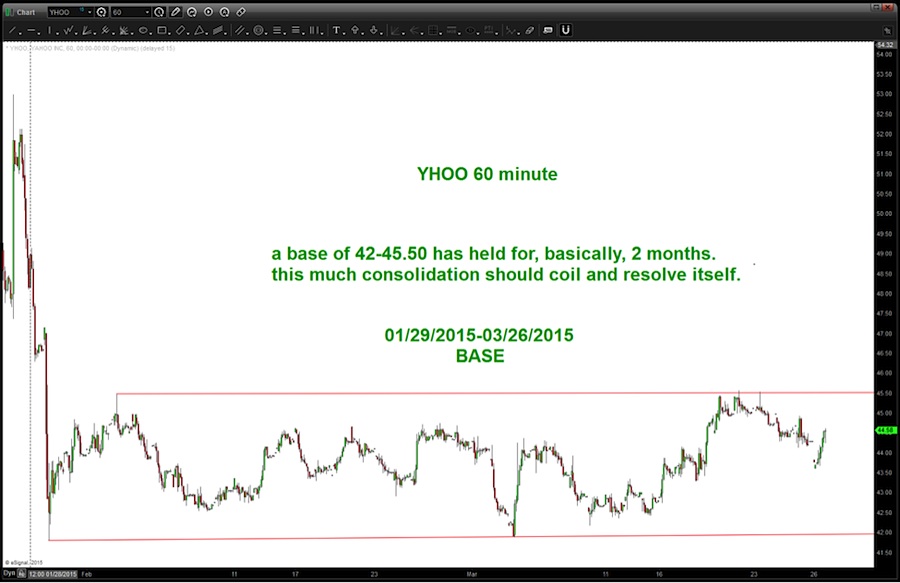
Below is an update from both a Monthly and Hourly chart perspective. Note that the upside target zone held as resistance and YHOO sold off from there. It then fell almost exactly to the polarity support that I highlighted as a target zone.
Even with the pullback, Yahoo stock price has been consolidating broadly for close to 3 months… and in this case, I would be inclined to go with the flow as a breakout higher or a breakdown lower should see some follow through momentum. To that extent, the coming days should provide some clarity.
Yahoo (YHOO) – Monthly Chart
Yahoo (YHOO) – Hourly Chart
Thanks for reading.
Follow Bart on Twitter: @BartsCharts
No position in any of the mentioned securities at the time of publication. Any opinions expressed herein are solely those of the author, and do not in any way represent the views or opinions of any other person or entity.


