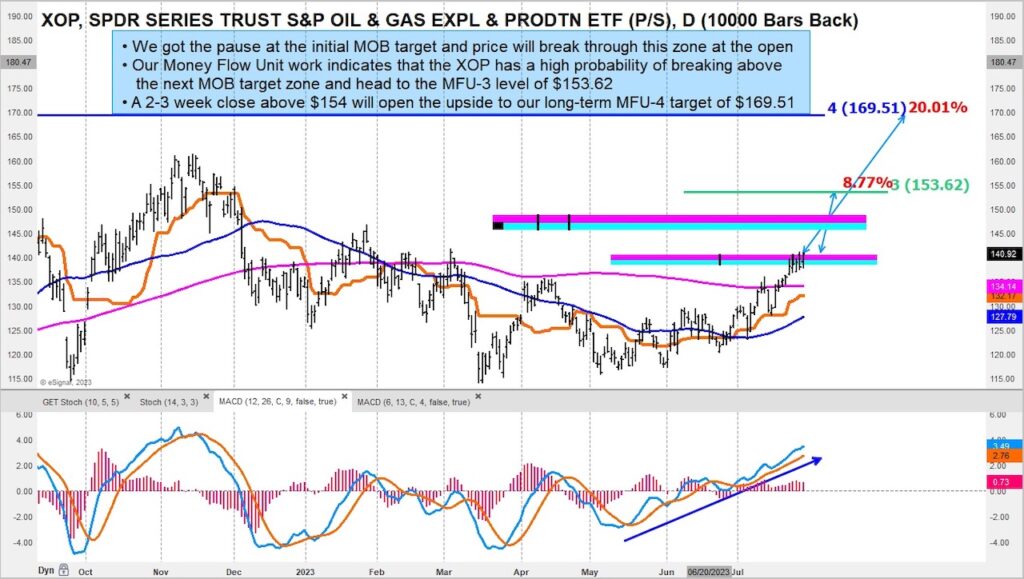
I remain long (bullish) the Oil and Gas Exploration ETF (XOP) and believe that the current pause is a bullish consolidation.
Furthermore, I also believe that the next leg higher is about to begin.
Below is a chart of XOP with our unique support/resistance price target system. Here we can see that XOP could be setting up for a +8% move higher and potentially higher. But we have to take one resistance band at a time.
Keep an eye on today’s current breakout attempt.
$XOP Oil and Gas Exploration Sector ETF Chart

Twitter: @GuyCerundolo
The author or his firm have a position in mentioned securities at the time of publication. Any opinions expressed herein are solely those of the author, and do not in any way represent the views or opinions of any other person or entity.


