It’s been quite a tumble for shares of Wynn Resorts (WYNN). Back in early 2014, WYNN stock price peaked up around 250 dollars per share. Today, it trades closer to 100. But the fact that WYNN has fallen further shouldn’t be a surprise for readers, as 6 months ago I wrote about why WYNN was a broken stock (technically speaking).
So where is WYNN now? Let’s take a look at the charts and see what the patterns appear to be telling me.
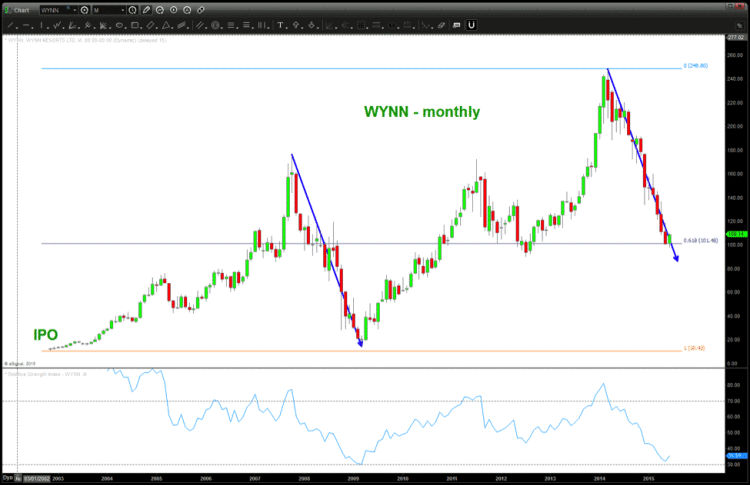
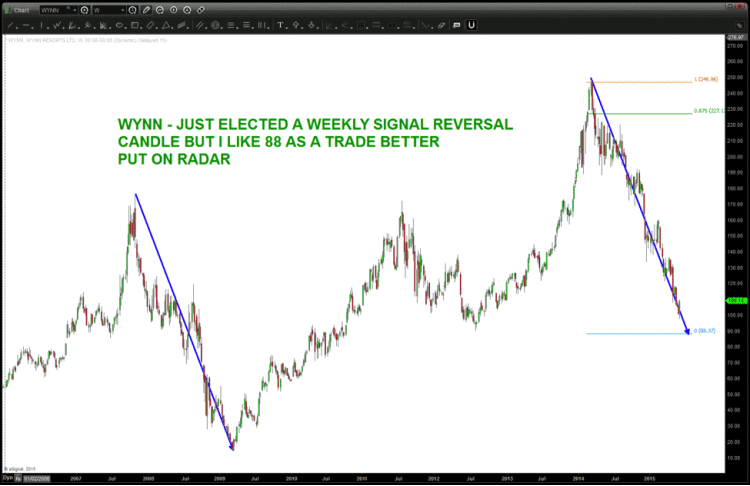
From a PATTERN perspective WYNN stock has hit the .618 Fibonacci retracement from its IPO. However, if you have been following my work you know I am really fond of the “measured move”. And if we look at the angle and geometry of this move, I think it’s probably best to remain patient and look for a bit lower prices, perhaps using 88 as the next targeted support (and potential zone to trade against).
Patterns help traders identify levels to trade against (using stops to define risk). And with that in mind, WYNN may just find its footing between here and 88.
WYNN Monthly Chart (with .618 Fibonacci Level)
WYNN Stock – Measured Move Targeting 88?
Stay tuned and thanks for reading.
Twitter: @BartsCharts
No position in any of the mentioned securities at the time of publication. Any opinions expressed herein are solely those of the author, and do not in any way represent the views or opinions of any other person or entity.


