Investing is not easy and never has been.
However, the healthy performance of bonds and equities over the past 30 years has certainly helped reduce the portfolio impact of any missteps along the way.
The adage “a rising tide lifts all boats” certainly holds true. Over the past three decades global equities and bonds have each annualized between 7- 7.5%.
Even if you knock off about 1.8% due to annualized inflation during that period, you are still looking at a real return over 5% from these major asset classes. This is a pretty friendly environment for creating wealth with a standard 60/40 buy and hold strategy.
What about the next 5 or 10 years?
This is when things get a little more sobering. The bond universe, which has contributed a relatively steady 7% annualized performance over the past three decades will be hard pressed to continue this trend.
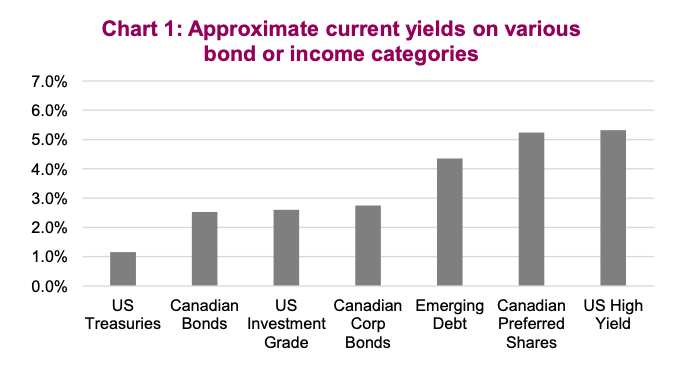
The yield is currently about 2.5% (Chart1), which means that to maintain a 7% total return, price appreciation would need to contribute about 4.5% a year. Since bond prices go up when yields go down, we would just need bond yields to move down enough to lift performance by 4.5% (annually).
Given the current duration (sensitivity of bond prices to changes in yields) of about 8, we would need yields to fall about 0.5%… per year (simplifying here). You can probably imagine where we are going. To maintain a 7% return on bonds for the next 5 years, we would need yields to drop deep into negative territory for government bonds and maybe even investment grade.
This is a simplification, ignoring credit, changing bond-market constituents, convexity, etc.
However, the conclusion remains: from current levels of bond prices, yields and credit spreads (historically low), generating 7% from a broad- based bond allocation seems unlikely during the 2020s. Let’s assume yields, along with credit spreads, remain flat over the next 5 years, a broad-based bond allocation will then generate about 2.5% annually.
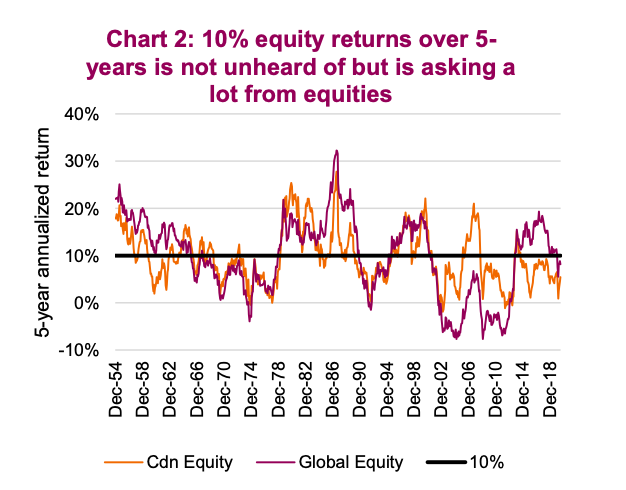
If bonds are “doing” 2.5%, that means for the 60/40 to maintain its 7.0% annualized nominal return, the 60% in equity has to do a lot heavier lifting. In fact, the equity portion would need to enjoy 10% annualized returns. That is not unheard of (Chart 2). However, it would imply in 2025 that the TSX reaches 24,350, the S&P 4,960 and the Dow to ring in at 40,000.
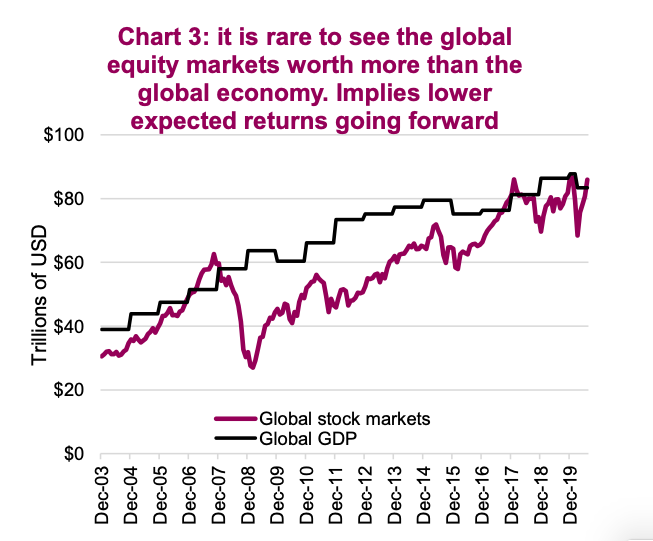
Equities may be hard-pressed to achieve this based on current levels or valuations. We will ignore earnings as these are depressed currently and tend to be very volatile. Perhaps a better longer-term valuation gauge is the value of the global stock markets to the global economy. While the equity markets and the economy can diverge for periods given fluctuations in the earnings multiple, there is a long -term correlation. Currently, the total value of global equities is a little higher than the global economy ($86 trillion versus $83 trillion). This is rare (Chart 3), and certainly adds to the case for more muted equity market returns in the years ahead.
If equity returns are somewhat muted and bond returns are even more challenging, the static 60/40 portfolio may have some tough years ahead.
What is an investor to do?
If you agree with the above analysis that a static buy-and-hold 60/40 portfolio utilizing broad market exposure investment vehicles for bonds and equities will be challenged in the coming years, below are a few potential options to help address this. Keep in mind, there is no free lunch out there. If market returns are going to be muted, the following strategies may help but they do involve taking on more risk, in one fashion or another.
1) Stretch for yield to enhance “bond” returns
During the current historically low-yield environment, a very common solution has become stretching for more yield by moving down the credit spectrum – essentially, taking on greater credit risk in return for higher yields. The downside is that the defensive characteristics of these holdings are not nearly as strong during times of market or economic stress. Plus, with credit spreads (yield pickup from corporate bonds over government bonds) at historical lows, the yield pickup is not very much (see Chart 1). This forces investors to go even further down the credit spectrum to high yield, Emerging Market debt, preferred shares, etc.
Still, there is a pickup in return expectations, albeit with added risk.
2) Alternative strategies
To enhance returns, many investors have turned to adding alternative strategies such as hedge fund, private equity, private debt, real assets, etc. While the strategies vary greatly and are beyond the scope of this report, many attempt to capture an illiquidity premium. The benefit of this is the possibility of enhanced returns but with less liquidity for the investor.
3) Leverage
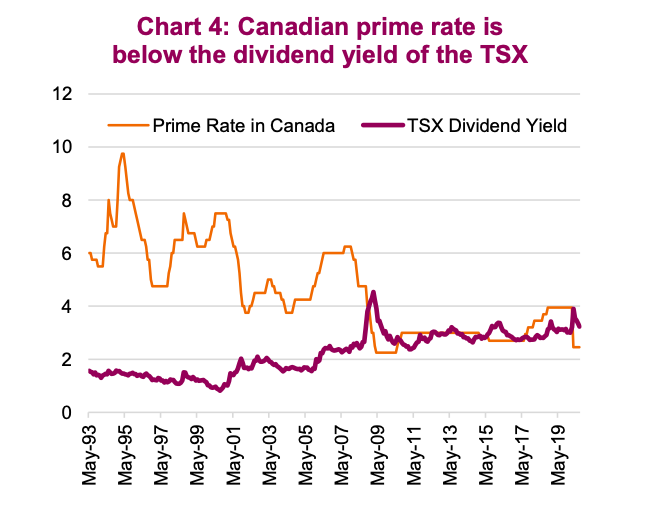
Leverage is dangerous and clearly adds risk and volatility when applied to a portfolio. That being said, IF the return is going to be positive and greater than the cost to borrow, leverage will enhance the overall rate of return. With interest rates, or the cost to apply leverage, historically low this does help the argument (chart 4). So does the potential tax treatment of the interest expense. Make no mistake though, leverage adds risk, and nobody likes margin calls.
4) Become more tactical
Even if returns end up being muted over the coming years, say 3-4%, that does not mean there won’t be big swings up and down. For instance, the trailing 5-year annualized return for the TSX is a modest 5% while the individual calendar year returns since 2015 include -8.3%, +21.1%, +9.1%, -8.9% and +22.8%. So far in 2020 the TSX is flat, but it certainly has not been a flat year.
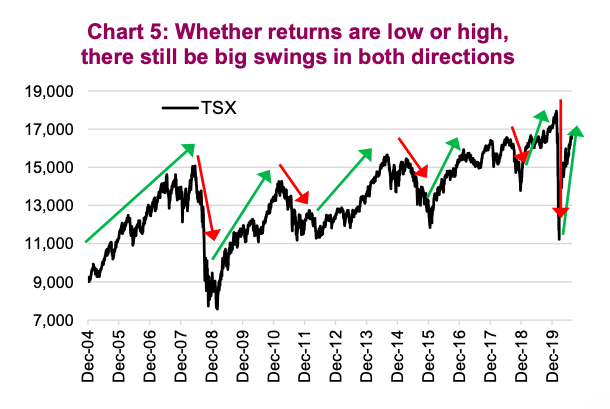
A buy-and-hold static asset allocation strategy simply goes along for the ride without any adjustments. When return expectations are higher, that is often an easier strategy to implement, as the rollercoaster ride finishes at a much higher level. However, if return expectations are low, utilizing a process to have greater equity exposure during the upswings and less during the downswings along the way can help your portfolio finish at a higher level than the static 60/40 strategy.
All charts are sourced to Bloomberg L.P. and Richardson GMP unless otherwise stated.
Twitter: @ConnectedWealth
Any opinions expressed herein are solely those of the authors, and do not in any way represent the views or opinions of any other person or entity.


