The Twin Profit Bulls of Medical Devices and Surgical Systems: Winning with stocks $BSX and $ISRG.
This is a story of how a market long in the tooth can sometimes hide opportunities that are near and dear to your shoulder, knees and hips.
Here’s how we rode Boston Scientific (NYSE:BSX) from $7.86 to $27.32 for a 247% gain and Intuitive Surgical (NASDAQ:ISRG) for a 64% gain.
We have been in Boston Scientific stock since 2013 at a modest $7.86, even though the breaks it took felt a little more like extended care.
Boston Scientific Corporation (BSX) is a worldwide developer, manufacturer and marketer of medical devices whose products are used in a range of interventional medical specialties, including interventional radiology, interventional cardiology, peripheral interventions, neuromodulation, neurovascular intervention, electrophysiology, cardiac surgery, vascular surgery, endoscopy, oncology, urology and gynecology.
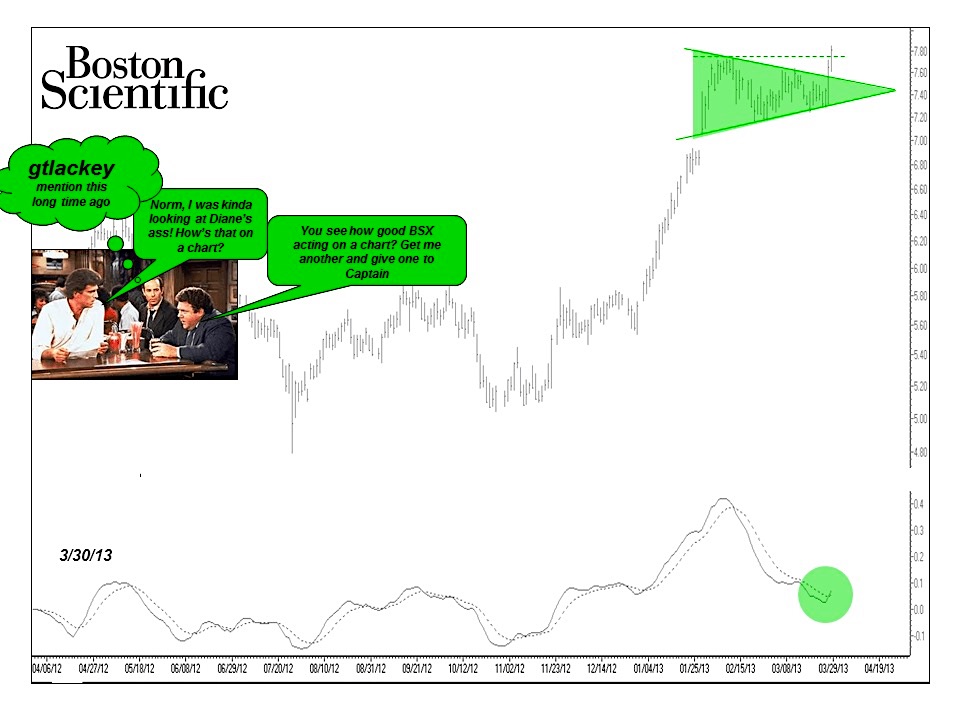
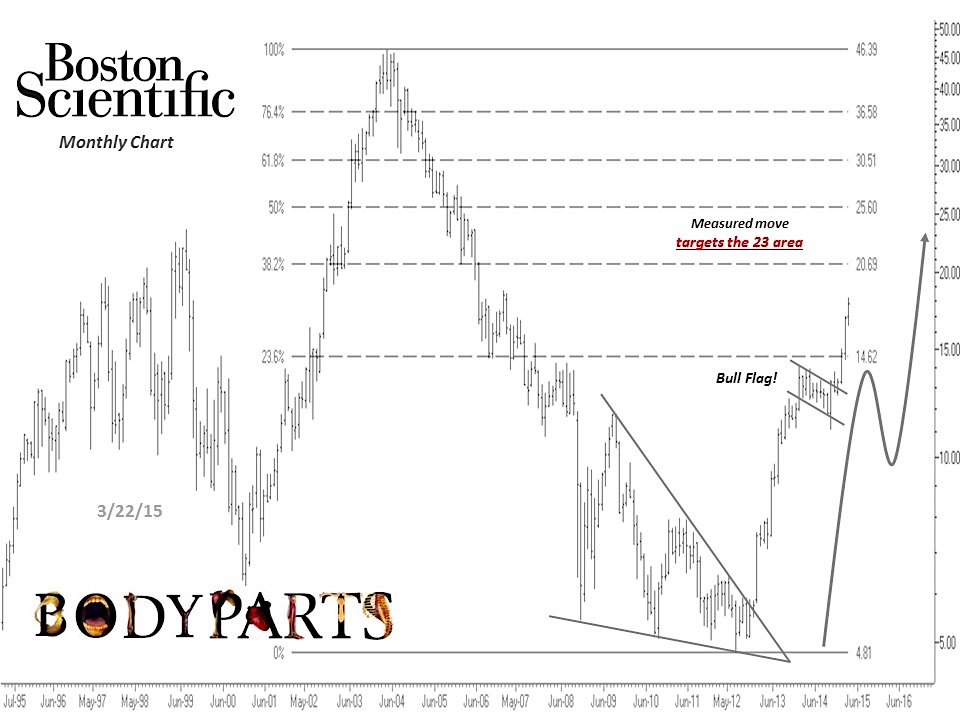
We first posted about Boston Scientific stock in March of 2013, and at time the weekly close price was $7.86. It’s stock price had broken out from a bullish Symmetrical Triangle that teased traders by taking it’s sweet time coiling from January 2013 to Spring of that year. We updated our analysis on March 23, 2015 with the original chart from 2013 stating that, “…it more than achieved its price objective and appeared to be ready to move again. The bullish flag is suggesting a measured move to the 23 area, when looking at this monthly chart. While it appears to have to overcome some Fibonacci resistance along the way, this monthly view shows an even more bullish view!”
At the time we felt the Point & Figure vertical price objective had a great chance of eventually being met.” See post here.
Our March 23, 2015 bullish call was shooting for 23 and it hit the target June 6, 2015. Shares of Boston Scientific started heating up again November 2015, with price and relative strength vs. S&P 500 breaking out.
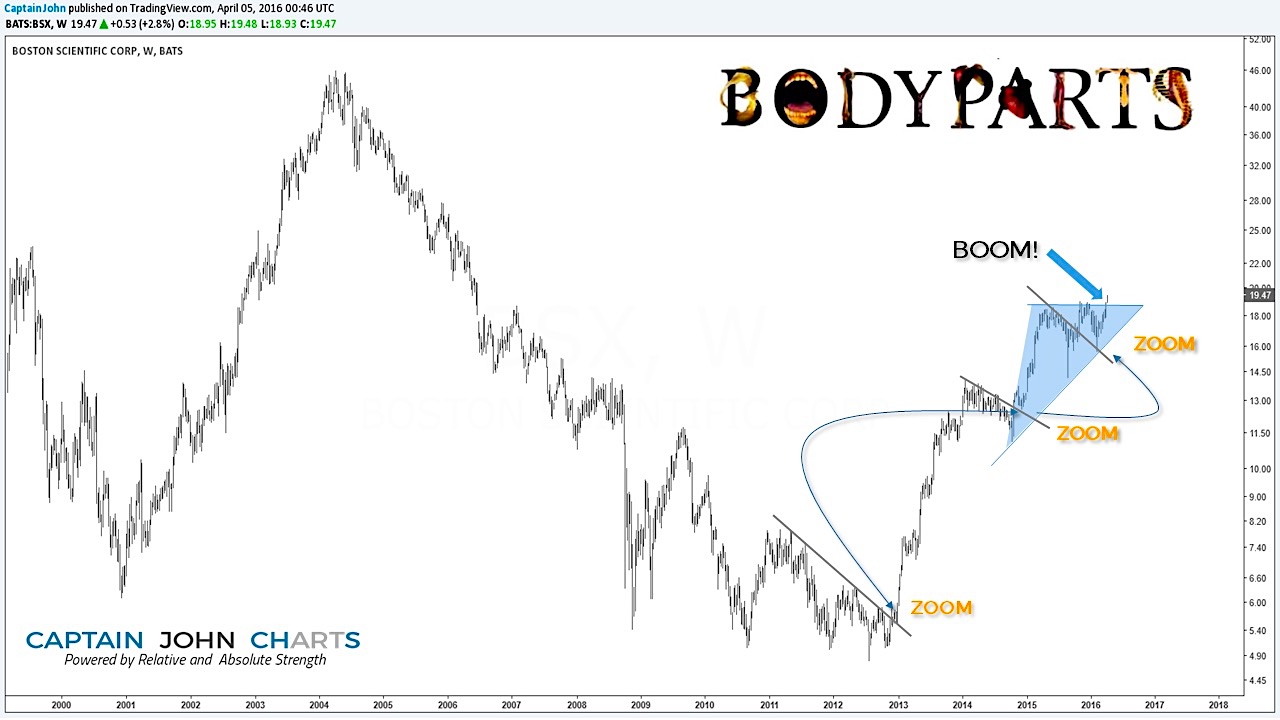
In December of 2015, we shared with followers that the weekly chart (pictured below) of BSX had a pattern that liked to break the down trend, test and then move back up ratcheting up more profits. This breaking down through the trend line more than likely frustrated investors. The Monthly charts vs. the S&P 500 continued to be supportive in December, though, grinding along a bullish trend line with a few bullish candles and a possible month end Relative Strength breakout.
“It looks encouraging that we will continue with a nice Absolute and Relative chart Breakout; and that is beautiful considering the flat market over this past year!” – December 17, 2015
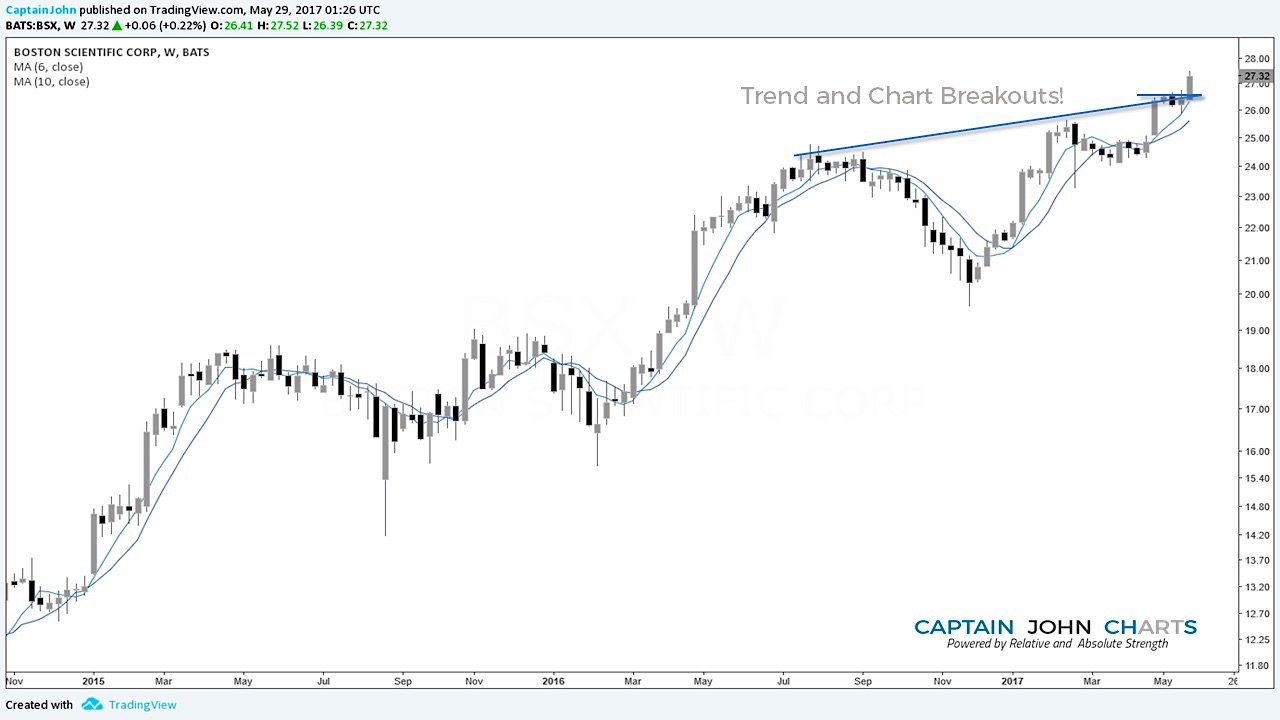
The current weekly stock chart of Boston Scientific shows a recent bullish cross over of the 6 MA right at the most recent break out early May and now has broken out from the longterm trend line. When reviewing stock charts in depth theirs one simple fact that should always stand out; if the chart is moving up left to right, it’s a winner.
How much of a winner is it? For us, the gains are 247% as of Friday May 26th market close. Had you followed John and I and invested $50,000 in just this name, from 2013 to present, your profit would be $123,500 which leaves you sitting on a nice profitable portfolio totaling, $173,500. If you had also played options selling puts and or taking the short side in those drawdowns that overshot the support, the gains could be exponentially larger.
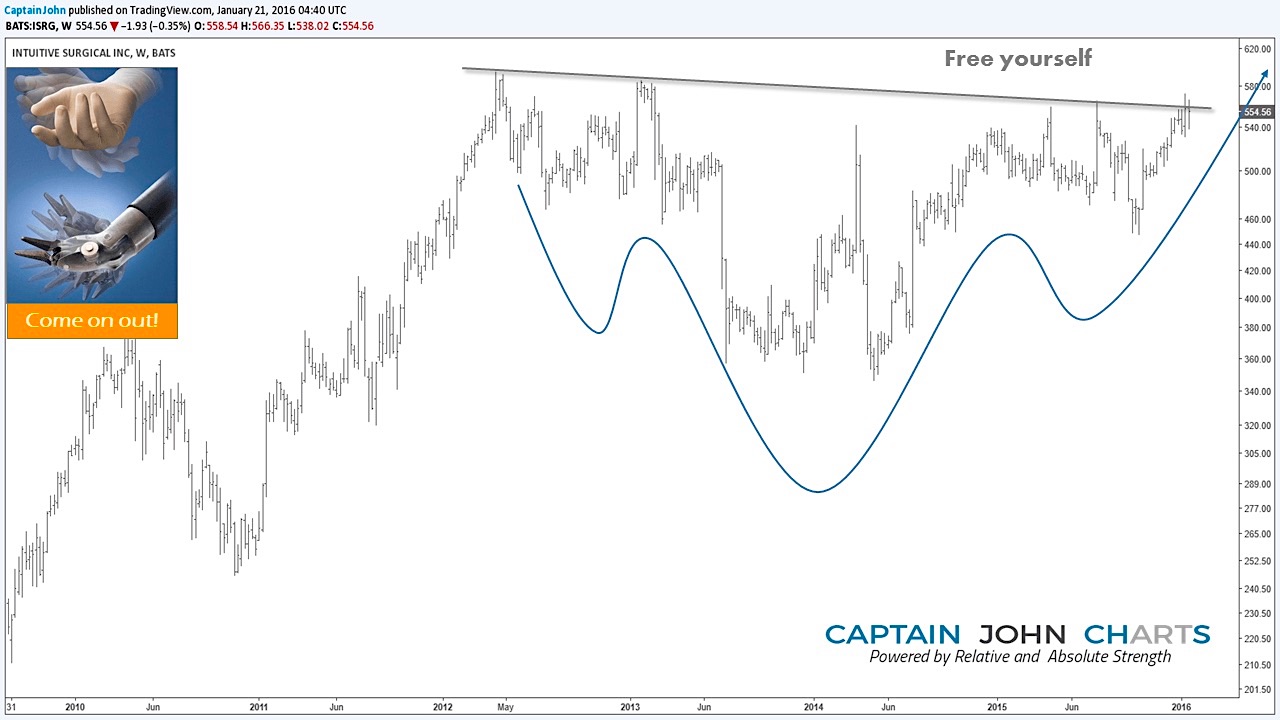
Let’s take a look at Intuitive Surgical (ISRG). This American company manufactures robotic surgical systems, most notably the Da Vinci Surgical System. This system allows surgery to be performed using robotic manipulators. In a post on January 21, 2016 the price action on a weekly chart appeared to be forming a 4 year base; and closed at $554.56.
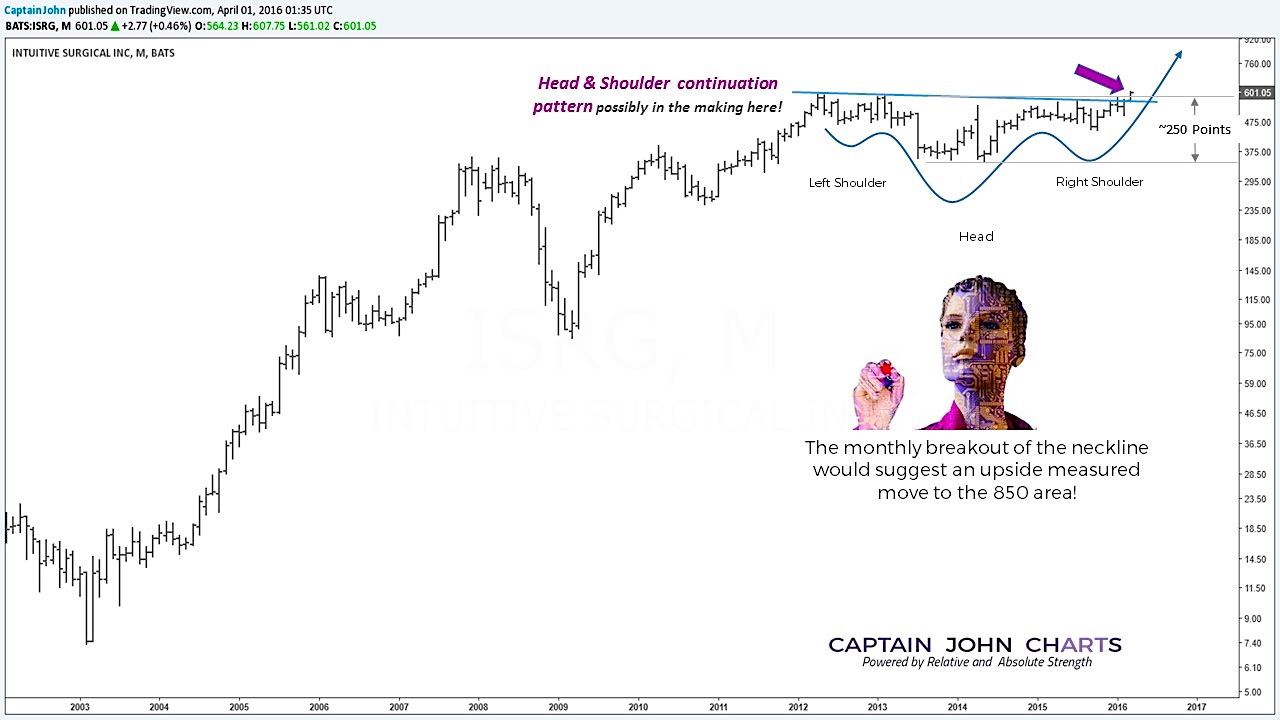
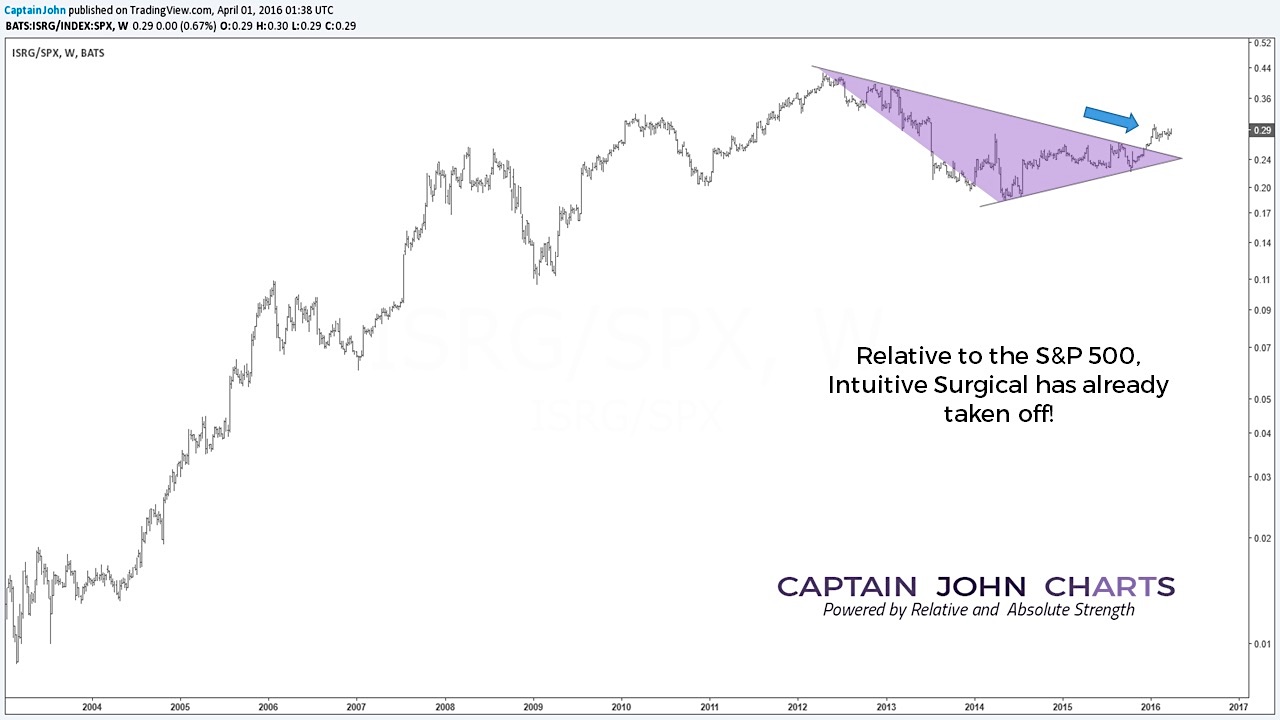
We advised premium members that if it resolved to the upside, “it would lead to some fantastic gains.” It also had already started to outperform the S&P 500 with good follow through to the previous weeks breakout. On April 1, 2016 the monthly chart showed a Head and Shoulder continuation pattern and the monthly breakout of the neckline suggested an upside measured move to the 850 area. That is a 250 point move!
Relative to the S&P 500, $ISRG was still very actionable.
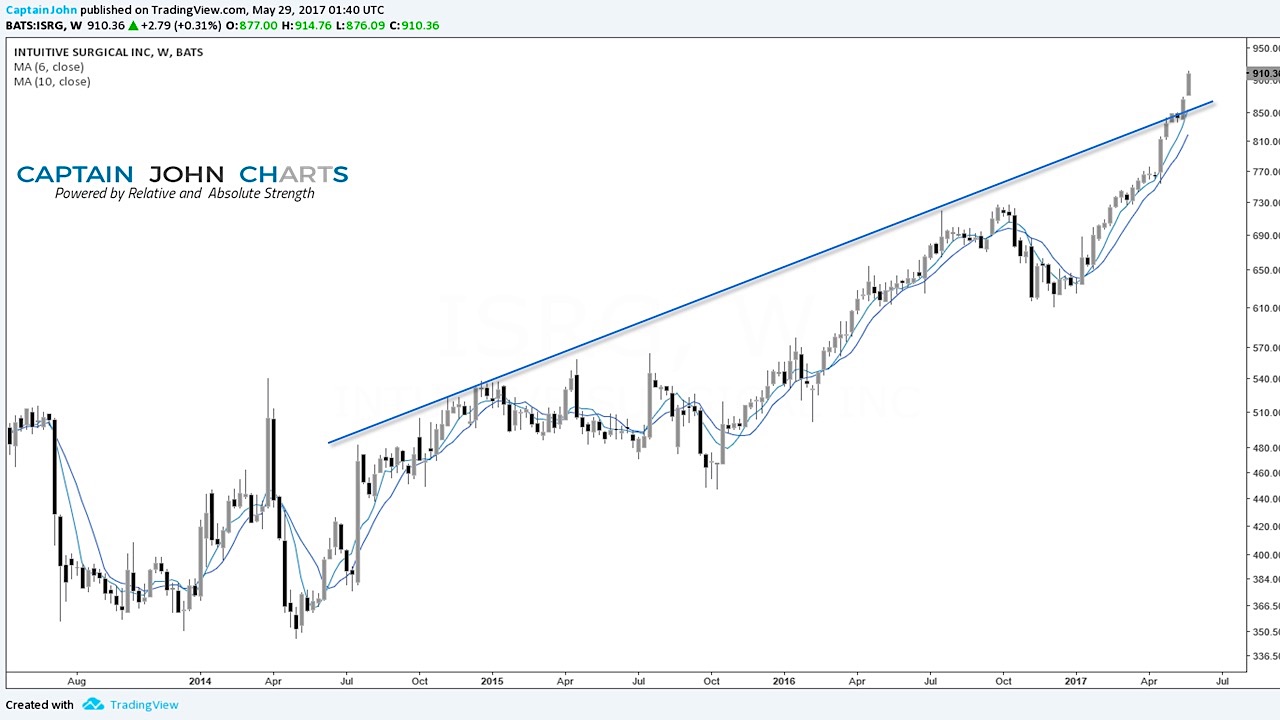
The weekly chart dated May 29, 2017 shown below, shows price closed at $910.36. That is a 64.16% gain.
The May 30th point and figure stock chart is in a Long Tail Up pattern since late April and the bullish price objective of 809 has been met. Thomas Dorsey calls these Spike chart patterns. The point and figure upward spike is when “a rally exceeds the previous column of X’s by at least 10 boxes” and suggests this can be a signal to take profits because spikes reverse sharply. It is possible to have two more spikes in succession, so “be on the lookout for a short pull back that is no more than 3 boxes. If a breakout begins again, stops should be kept tight and the breakout entry is above the previous high.
Get more trading ideas, chart insights, investing research over on our site, Captain John Charts.
Here’s to your success. Have a great rest of your week!
Twitter: @CptJohnCharts
StockTwits: @CaptainJohn
The author has a position in the mentioned securities. Any opinions expressed herein are solely those of the author, and do not in any way represent the views or opinions of any other person or entity.

