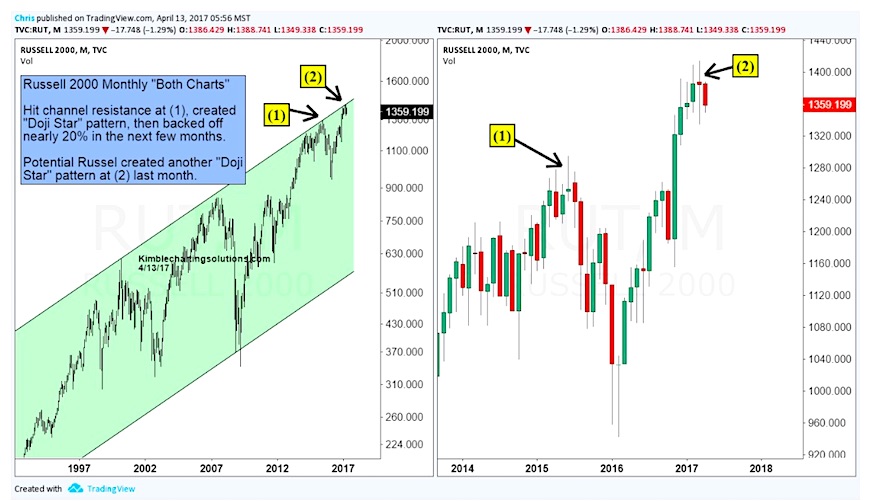
The Russell 2000 (INDEXRUSSELL:RUT) has traded lower since early March when it hit new all-time highs.
This recent bout of weakness assisted in forming a “doji star” candle on the monthly chart (see point 2 below). And note that this doji star candle formed near rising channel resistance.
So why is this important?
A doji star candle is a sign of indecision in the market. The last time that a doji star candle formed at the top of channel resistance (see point 1 below), the Russell 2000 declined 20 percent.
The past isn’t necessarily a predictor of the future, but if further weakness takes place following the doji star, it may represent an important high. Or at a minimum, important resistance. Since this is a monthly chart, it will take a month or two to determine it’s significance.
Russell 2000 “Montly” Chart – “Doji Star” reversal taking place?
Thanks for reading.
ALSO READ: S&P 500 Rally Stalls At Key Fibonacci Price Level
Twitter: @KimbleCharting
Any opinions expressed herein are solely those of the author, and do not in any way represent the views or opinions of any other person or entity.


