The stock market crash of 2020 is well underway and moving closer to a bottom by the day.
When “it” happens (likely in the next 2-3 trading sessions), it may not be a “final” bottom but definitely a 3rd wave-like panic bottom.
That said, active investors with cash, new money, or looking to rotate have to have a patient, measured plan. That typically involves identifying price levels that an individual would like to buy in at… and, in my opinion, it’s always best to buy in increments (and using a stop if a short-term trader).
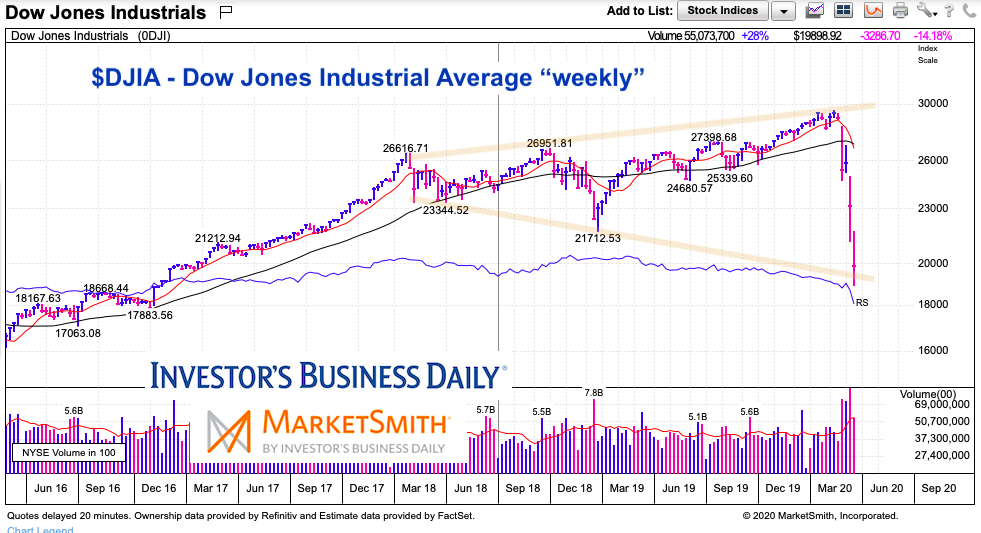
In today’s chart, I simply provide an update to a Dow Jones Industrial Average chart that I shared Monday on Twitter. In that chart I showed a rare technical chart pattern called a megaphone, showing where deep support resided. Today, I show it again.
Note that the following MarketSmith charts are built with Investors Business Daily’s product suite.
I am an Investors Business Daily (IBD) partner and promote the use of their products. The entire platform offers a good mix of technical and fundamental data and education.
Dow Jones Industrial Average “weekly” Chart
As you can see, the Dow Industrials has touched down on the lower end of the megaphone / broadening pattern. Undercutting this support briefly and reversing higher above it (and holding) would be the most bullish outcome. Playing this after a reversal defines risk, as a stop can be placed at the lows of the candle wick (for traders).
It’s also worth noting that 18,019 is the 50 percent Fibonacci retracement of the entire 2009 to 2020 bull market. Almost there in just 5 weeks. Crazy time.

Twitter: @andrewnyquist
The author may have a position in mentioned securities at the time of publication. Any opinions expressed herein are solely those of the author, and do not in any way represent the views or opinions of any other person or entity.


