Precious metals prices have languished in a sideways pattern since peaking out in July 2020.
Could this sideways trading pattern be a bullish consolidation pattern?
Strong silver price action = bullish precious metals
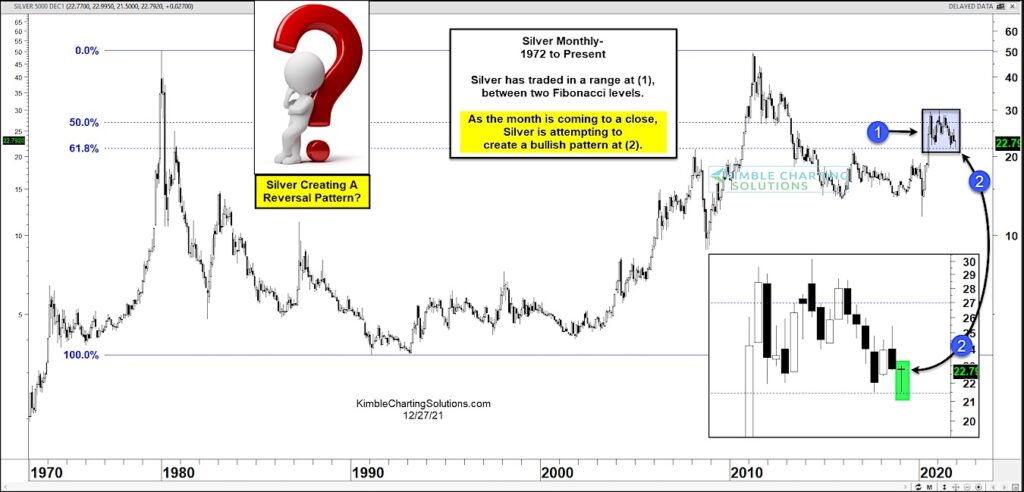
Today’s chart takes a look at the long-term “monthly” view of Silver.
As you can see, Silver has spent several months trading between the 50% and 61.8% Fibonacci levels at (1). BUT this month, Silver is attempting to create a bullish reversal pattern at (2). Continued strength into month-end could return the luster to precious metals.
This is a pivotal spot for Silver. A turn higher here would be bullish for Gold too! Stay tuned!
Silver “monthly” Price Chart

Note that KimbleCharting is offering a 2 week Free trial to See It Market readers. Just send me an email to services@kimblechartingsolutions.com for details to get set up.
Twitter: @KimbleCharting
Any opinions expressed herein are solely those of the author, and do not in any way represent the views or opinions of any other person or entity.


