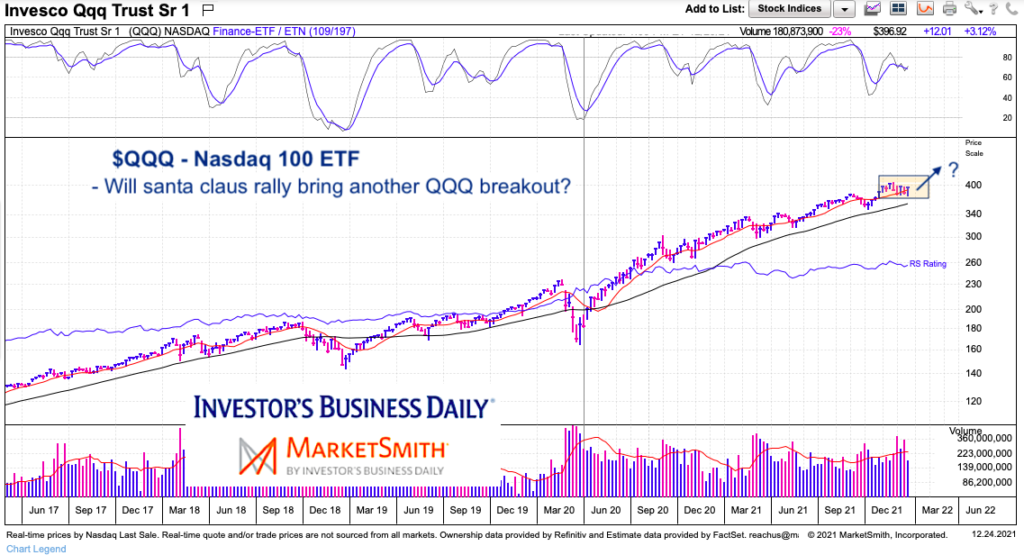
It’s been another strong year for tech stocks. But a multi-week consolidation has lead to sideways trading.
Boring, right? So, what could change this dynamic and bring another dose of optimism and bullishness into the new year?
Well, according to Ryan Derrick, we are about to embark upon a period known as the santa claus rally. This period is seasonally strong and lasts into the first week of January. And this period of strength follows a week in which QQQ put in a bullish candle. Let’s look at the chart.
Note that the following MarketSmith charts are built with Investors Business Daily’s product suite.
I am an Investors Business Daily (IBD) partner and promote the use of their products. The entire platform offers a good mix of analysts, education, and technical and fundamental data.
$QQQ Nasdaq 100 ETF “weekly” Chart
Here we can see the consolidation as well as last week’s long bullish wick. If seasonality brings a couple weeks of strength, it could lead to new all-time highs.
One kicker: volume tends to be light and current RS/momentum is middling. Watch how the next two weeks develop… perhaps new highs are meant to be sold.

Twitter: @andrewnyquist
The author may have a position in mentioned securities at the time of publication. Any opinions expressed herein are solely those of the author, and do not in any way represent the views or opinions of any other person or entity.


