The Retail Sector Indicator has been reliable.
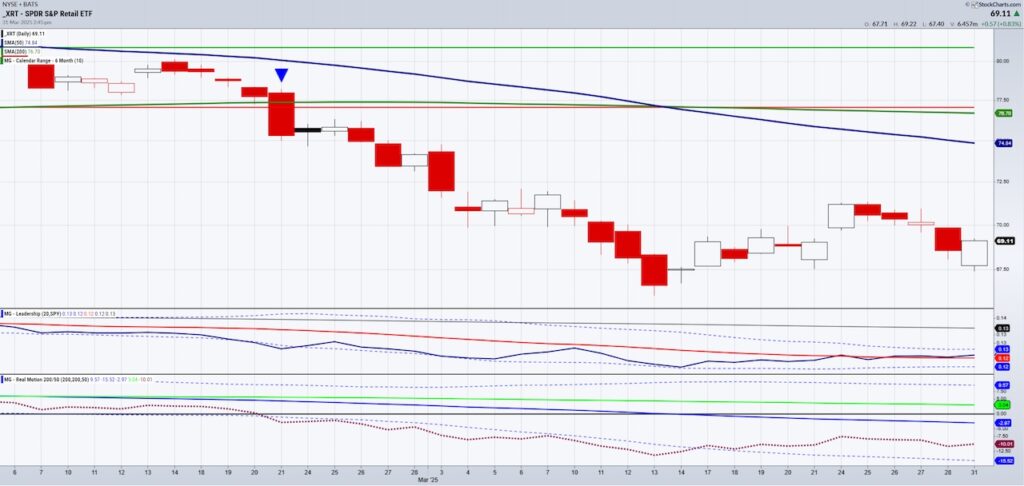
In late January, early February, while everyone was still so bullish, the Retail Sector ETF (NYSRARCA: XRT) failed at its high of the January 6-month calendar range and then its 50-daily moving average.
The slope on that moving average went negative, and the price continued to sink.
One of the worst performing sector ETFs, Retail (XRT) is a great barometer for the market and economic sentiment.
On March 13th, XRT traded down to a low of 66.07, a price not seen since December 2023.
Now, at the end of the first quarter and ahead of April 2nd tariff announcements, the low was 67.39.
And as you can see from the chart, XRT went green.
However, is this the bottom or just another buy the dip, short covering rally that won’t last?
Note the Leadership indicator. Today, XRT outperformed the S&P 500 ETF (SPY) for the first time since last November.
On Real Motion though, momentum shows no real divergence.

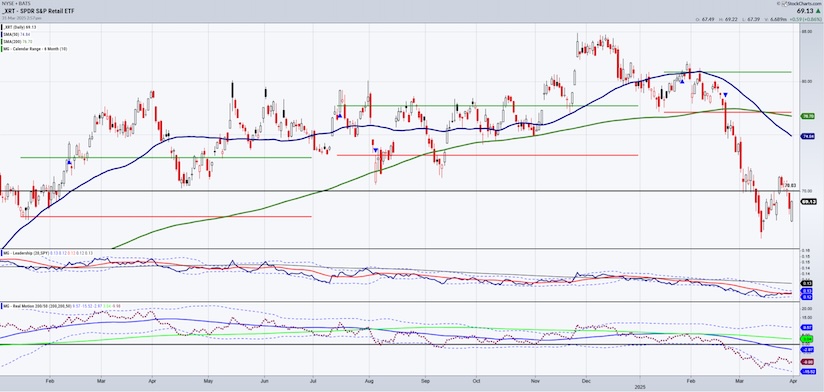
If you look at the price, the black horizontal line is an interesting pivotal area.
Going back to February 2024, then moving to April 2024, now March 2025, $70 has been a reliable line in the sand.
XRT looks better above there and not so healthy below.
That is the first hurdle.
The second hurdle is $72 where the 23-month moving average or measure of the 2-year business cycle lives.
For now, we are at least hopeful Granny has returned to shop.
However, in the current bearish phase, we know that short covering and premature buyers cause whipsaws.
What we do know is that if the Retail Sector ETF (XRT) has stopped the bleed, then the original predictions for 2025 are still intact:
Pain in the first quarter, followed by a better second quarter, then a 3-5% gain for the SPY by year’s end.
But let’s not get ahead of ourselves.
Twitter: @marketminute
The author may have a position in mentioned securities at the time of publication. Any opinions expressed herein are solely those of the author and do not represent the views or opinions of any other person or entity.


