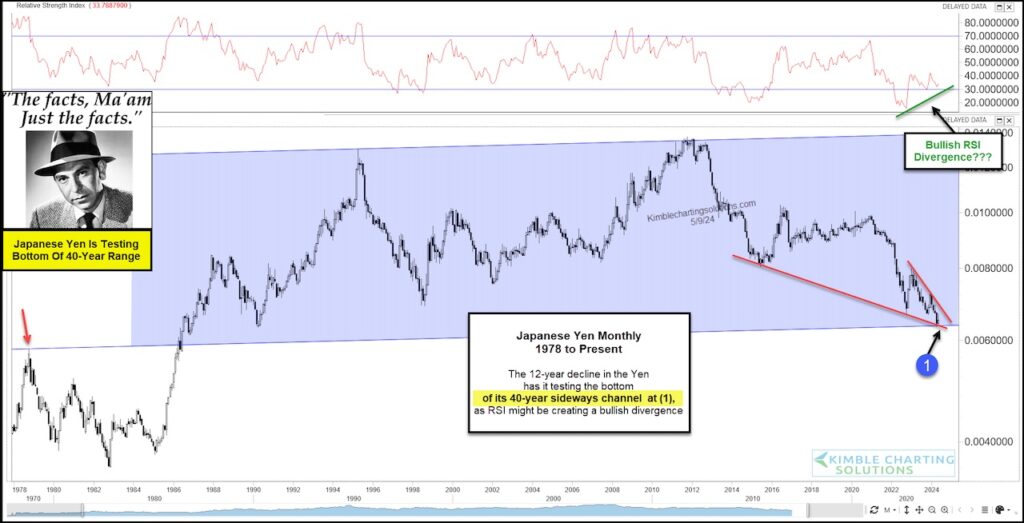
The Japanese Yen has tumbled to new multi-decade lows after its recent free fall.
Currently, the Yen is trading into 40-year support. Could this be the time/price area from which we see a rally?
Let’s take a look at the chart…
“The facts, Ma’am. Just the facts.” – Joe Friday
As you can see, the 12-year decline in the Japanese Yen has it testing the bottom of a 40-year sideways channel at (1). As well, we have a bullish divergence with the Relative Strength Index (RSI).
Looks like an important support test is in play for one of the hardest-hit currencies in the world. Time for a rally? Stay tuned!
Japanese Yen “monthly” Currency Chart

Note that KimbleCharting is offering a 2 week Free trial to See It Market readers. Just send me an email to services@kimblechartingsolutions.com for details to get set up.
Twitter: @KimbleCharting
The author may have a position in mentioned securities. Any opinions expressed herein are solely those of the author, and do not in any way represent the views or opinions of any other person or entity.


