As traders, investors and economists begin to take note of the rise in commodities prices, another related area is quietly gaining importance.
Interest rates.
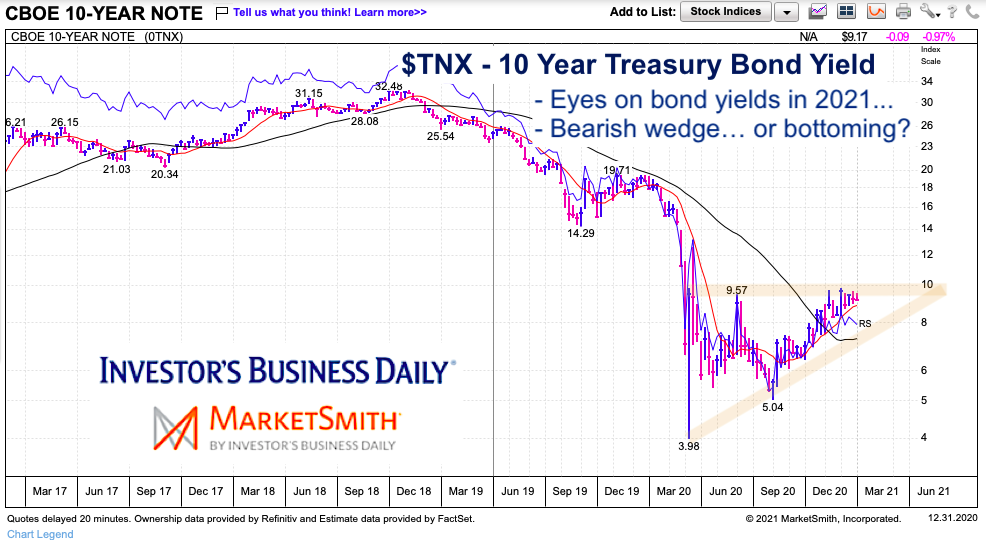
In particular, today I draw your attention to the 10-Year US Treasury Bond Yield (TNX) and the importance of the 1 percent level as a potential pivot area.
Note that the following MarketSmith charts are built with Investors Business Daily’s product suite.
I am an Investors Business Daily (IBD) partner and promote the use of their products. The entire platform offers a good mix of technical and fundamental data and education.
10-Year US Treasury Bond Yield “weekly” Chart
As you can see from the chart, we are looking at either a bearish wedge pattern into 2021 where bond yields (and interest rates) break lower… or we could be looking at a bottoming formation that breaks out over 1 percent and runs up to 1.5 to 2.0 percent. I’d typically lean toward the bearish wedge pattern but the 40 week is flattening and the 10 week is rising. So this becomes an interesting chart to watch in 2021.

Twitter: @andrewnyquist
The author may have a position in mentioned securities at the time of publication. Any opinions expressed herein are solely those of the author, and do not in any way represent the views or opinions of any other person or entity.


