The nine-year rally in gold prices might have ended, although there’s a scenario that would allow for one more new high to be made next year. In the near term though, we believe a decline is due.
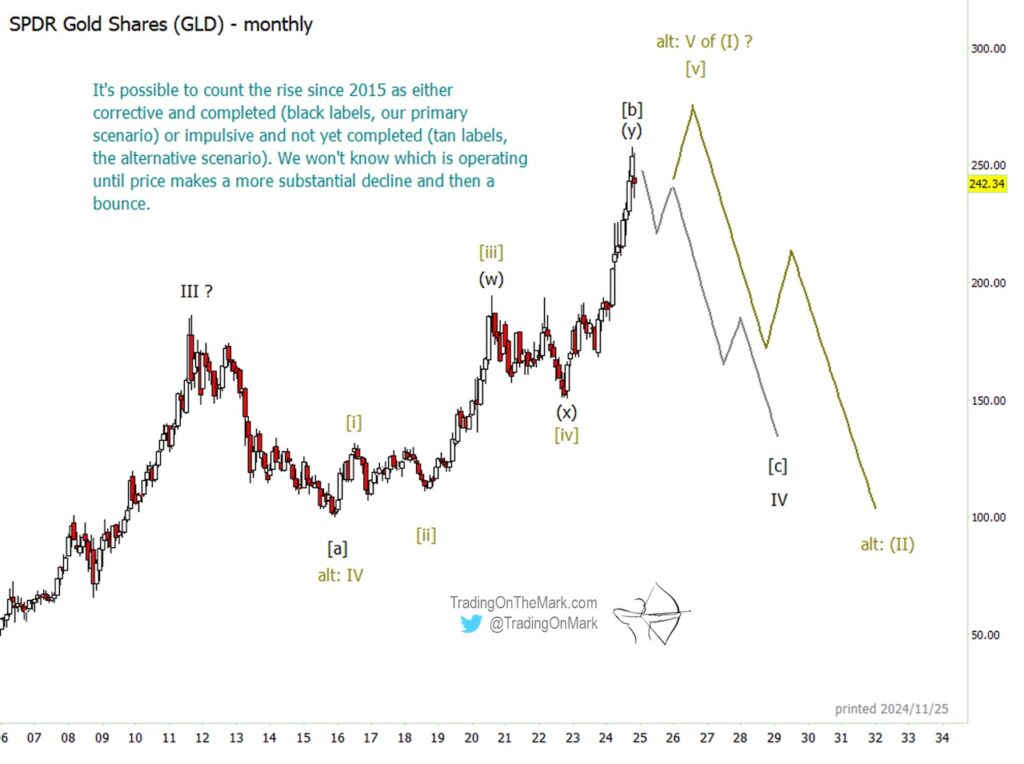
Charting the metal via the SPDR Gold Shares fund (NYSEARCA:GLD), it’s possible to count a completed upward structure from the low of late 2015.
A completed count implies that a substantial decline is due that could last several years. This idea is shown as our primary scenario, depicted with black wave labels and grey path on the monthly chart below.
An alternative way of viewing the structure requires that it make yet another new high before it can be counted as complete. We show the alternative scenario using tan labels and path lines.
The monthly chart shows broadly how the two scenarios compare. Both of them predict a sizable decline during the remainder of the decade. Additionally, both call for a smaller but still substantial decline from near the current price before the market decides which scenario to follow.

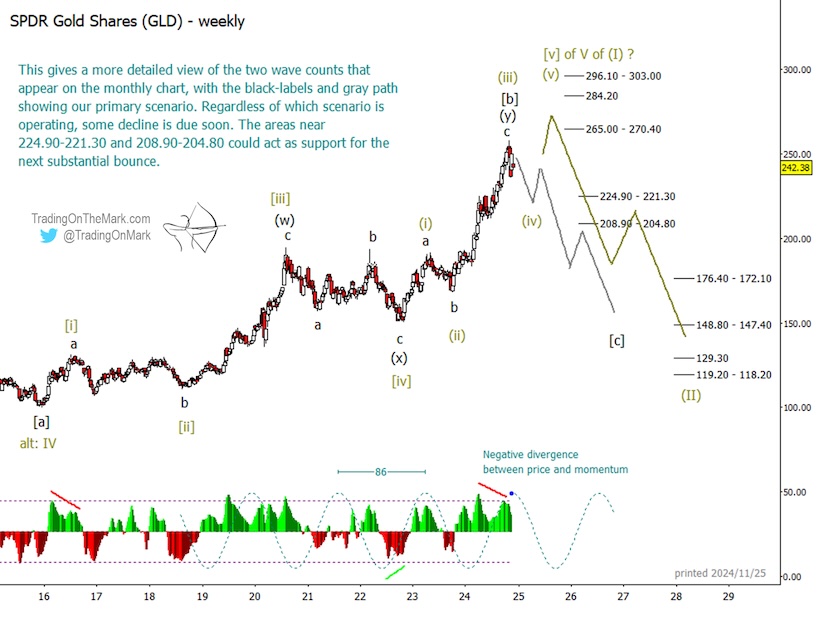
Most gold traders who monitor wave counts will have noticed the potentially complete five-wave move up from the October 2023 low. On our weekly chart below, the low is labeled as sub-wave ‘b’ in the black scenario and as sub-wave (ii) in the tan scenario. The potentially complete structure that would be relevant to traders working on medium-to-slow time frames is marked as black sub-wave ‘c’ and alternatively as tan sub-wave (iii).
The decline that follows the completed impulse ‘c’ or (iii) should turn into either a retrace of the impulse itself or the start of a new downward pattern.
We believe the market can postpone its ultimate decision about which scenario to follow until price tests one of two key support areas near 224.90 – 221.30 and 208.90 – 204.80. In the context of the primary (black) scenario, hitting either area would represent a test of the previous area of consolidation. In the context of the alternative (tan) scenario it would represent a typical wave (iv) retracement that sets the foundation for a final move higher.

Additional factors favorable to an imminent downturn include the price divergence shown by the adaptive CCI momentum indicator and also the current high phase of the dominant 86-week price-time cycle.
On a daily chart (not shown here) we’re monitoring the possible development of a lower high compared to the one in early November. That lower high would represent an upward retrace of the initial downward move. At the moment it looks as though the small corrective upward structure of the retracement might not be complete until sometime in after the turn of the year.
Elliott wave analysis identifies the places where the market is more likely to turn, as well as the possible target destination of a move. It also shows where price specifically should not go if the main scenario’s thesis is true. For a trader to make use of these “if this, then that” types of scenarios, it’s helpful to have guidance from people who have already integrated Elliott wave into their trading. Our newsletter follows crude oil, major stock indices, currencies, metals, bonds, and related markets on weekly and daily time frames. You can also inquire about our intraday service, which is more customized.
Twitter: @TradingOnMark
The authors may have a position in the mentioned securities at the time of publication. Any opinions expressed herein are solely those of the author, and do not in any way represent the views or opinions of any other person or entity.


