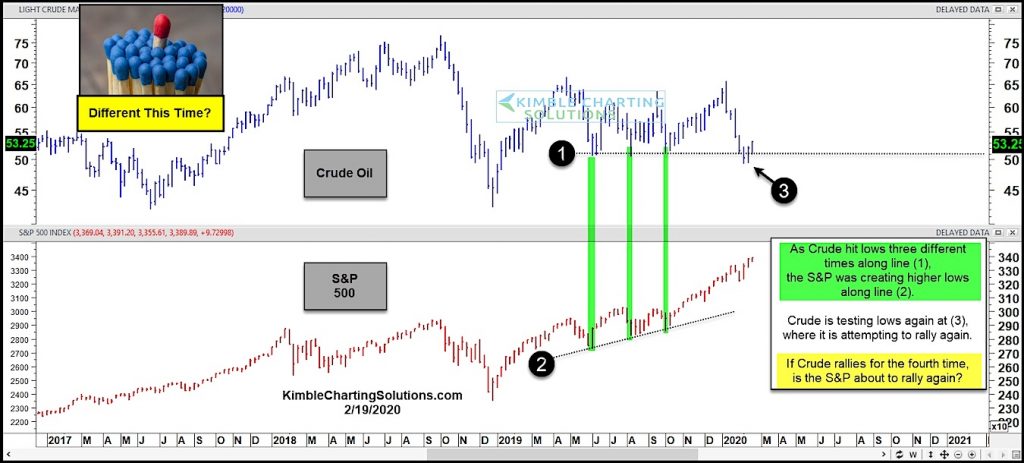
Crude Oil prices have been volatile the past year, swinging between $50 and $65 like a ping pong ball.
But the movement in oil prices has been well worth watching, especially for stock market bulls.
Each of the past 3 times that crude oil has tested the $50 support zone at (1), it has marked a low and subsequent rally in the S&P 500 at (2).
Crude oil is attempting to rally off support for the 4th time at (3).
If Crude Oil rallies yet again, will it push the S&P 500 even higher?
Or will the results be different this time? Stay tuned!
Crude Oil Prices versus S&P 500 Index Chart

Note that KimbleCharting is offering a 2 week Free trial to See It Market readers. Just send me an email to services@kimblechartingsolutions.com for details to get set up.
Twitter: @KimbleCharting
Any opinions expressed herein are solely those of the author, and do not in any way represent the views or opinions of any other person or entity.


