Copper Futures “weekly” Price Chart
For a long time, copper prices have been a bellwether to follow for economic conditions.
And while there are several other indicators that investors follow, this one may be sending a signal right now (for copper traders, as well as those monitoring economic conditions.
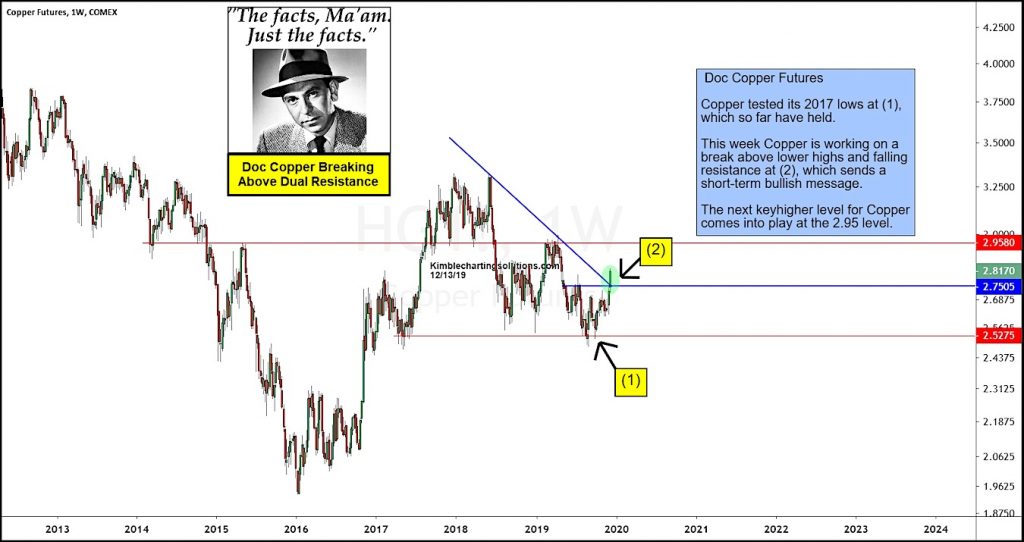
In the chart above, we can see that ole Doc Copper tested the 2017 lows at (1) and reversed higher.
Copper is currently trying to breakout above dual price resistance this week at (2).
If this move higher in Copper continues, will it reduce the likelihood of a recession? It’s possible – stay tuned!
Note that KimbleCharting is offering a 2 week Free trial to See It Market readers. Just send me an email to services@kimblechartingsolutions.com for details to get set up.
Twitter: @KimbleCharting
Any opinions expressed herein are solely those of the author, and do not in any way represent the views or opinions of any other person or entity.


