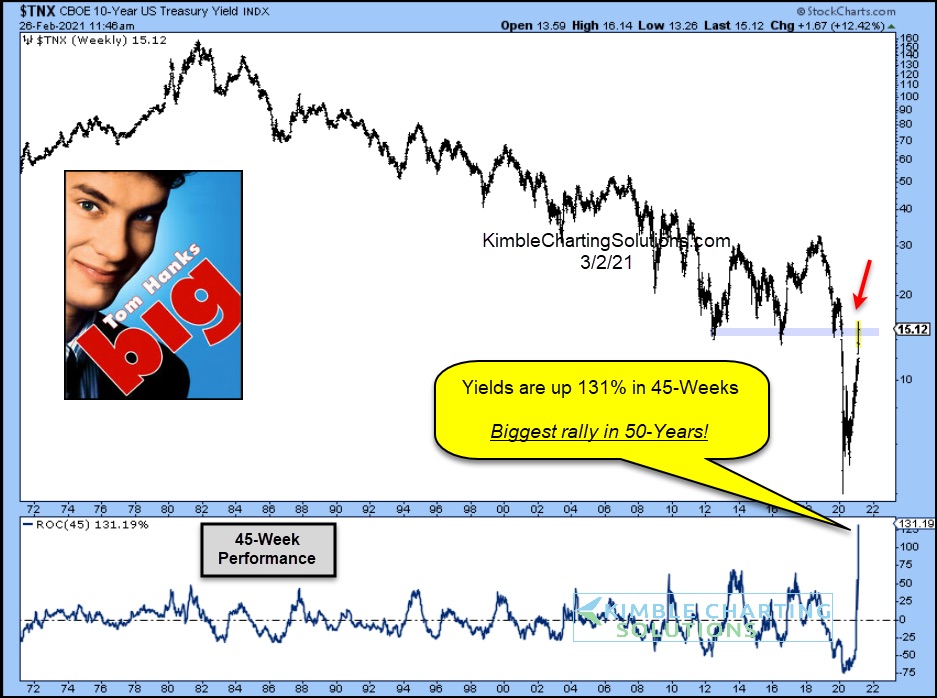
The waterfall decline of bond yields (and interest rates) has been met with an equally steep rally.
In fact, the 10-Year US Treasury bond yield is up 131% in 45 weeks, making it the biggest rally in 50 years! See the chart below.
Earlier today we asked if the 40-Year Bond Bull Market Is Over? And we highlighted how bonds and yields are facing an important test right now.
Will the record rise in bond yields continue? And will bond prices continue to collapse? If so, other areas of the stock market may become spooked / rattled. Stay tuned!
10-Year US Treasury Bond Yield Chart

Note that KimbleCharting is offering a 2 week Free trial to See It Market readers. Just send me an email to services@kimblechartingsolutions.com for details to get set up.
Twitter: @KimbleCharting
Any opinions expressed herein are solely those of the author, and do not in any way represent the views or opinions of any other person or entity.


