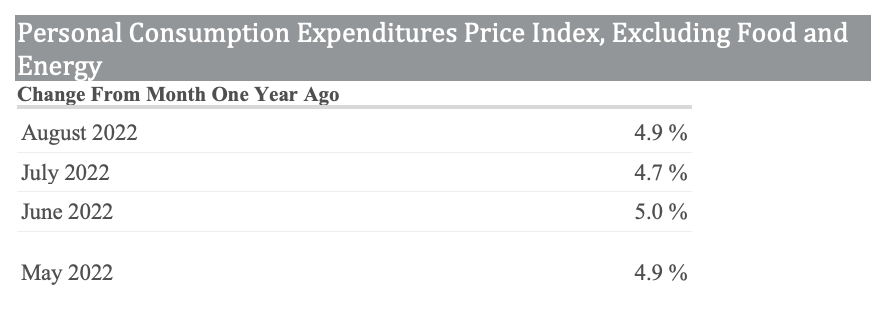
The PCE Price Index Excluding Food and Energy, also known as the core PCE price index, makes it easier to see the underlying inflation trend by excluding two categories – food and energy – where prices tend to swing up and down more dramatically. The core PCE price index is closely watched by the Federal Reserve as it conducts monetary policy.
It is crucial to prepare for adjustments in Fed policy and the credit markets and adjust your trading given the persistence of high inflation.
As seen above, The Fed preferred inflation gauge (core PCE) remained elevated at 4.9% in August, as data released Friday remains far above the Feds goal of 2%
It is worthwhile to think about how unique the selloff has been, why some anticipated it, and how might all of us trade better in the future.
I have one specific vehicle that I glance at daily, which tells me a lot about risk appetite and future equity returns.
Anyone can look at this vehicle and quickly see where the market is headed.

In response to high inflation, central banks have aggressively raised rates quickly. The speed of these hikes will influence our economy, and the current stock market carnage is a side effect.
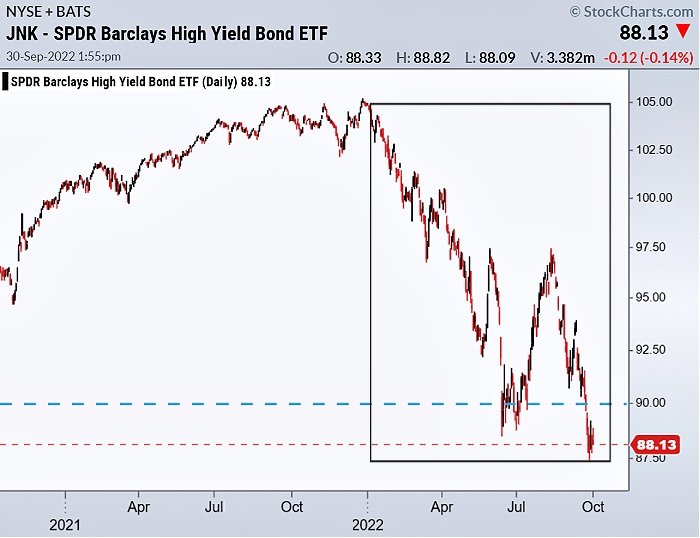
One of the many areas we watch are various credit markets and spreads. I follow the junk bond market. It usually leads the stock market since the credit market is cyclical and tends to be inter-correlated with the economy.
Please notice the Bloomberg High Yield Bond ETF (JNK) high yield corporate bond fund has taken out its previous low in the summer. The price tells us something important about the stock market’s direction.
On new yearly lows, unless we see that reverse, take it as a harbinger that the selling in the whole market is not over.
Please take a moment to watch Mish’s latest media clips where she outlines the macro down to the micro. We also invite you to become a MarketGauge subscriber for more regular analysis.
Stock Market ETFs Trading Analysis & Summary:
S&P 500 (SPY) 353 support and 358 resistance
Russell 2000 (IWM) 162 support now and 168 resistance
Dow Jones Industrials (DIA) 285 support and 289 resistance
Nasdaq (QQQ) 262 support and 268 resistance
KRE (Regional Banks) 57 support and 60 resistance
SMH (Semiconductors) 182 support and 188 resistance
IYT (Transportation) 194 support and 198 resistance
IBB (Biotechnology) 114 support and 119 resistance
XRT (Retail) 55.55 support and 58.56 resistance
Twitter: @marketminute
The author may have a position in mentioned securities at the time of publication. Any opinions expressed herein are solely those of the author and do not represent the views or opinions of any other person or entity.


