Commodities continues to be a hot topic. And there are several reasons for this. Here are five that come to mind:
- Crude Oil continues to fish for a bottom.
- Gold prices have languished ever since peaking back in 2011.
- Interest rates and the inflation/deflation debate continue to rage.
- Commodities striking divergence from US Equities.
- And of course, the soaring US Dollar.
Commodities sure have a way of touching all of the major asset classes. With that said, let’s take a look at one of the benchmark commodity indices, the Reuters/Jefferies CRB Index, to see where we stand and if the pain of the 34% decline since June 2014 is behind us. All of course, from a technical perspective.
Why the CRB Commodities Index? In short, following the CRB Index can give investors a sense of the broad spectrum of the commodities market as it is composed of Agricultural (41%), Energy (39%), Base/Industrial Metals (13%), and Precious Metals (7%) commodities.
To begin with, let’s take a look at the long-term monthly chart to see if we have hit bottom or if we still have to leave the question “How low is low?” open.
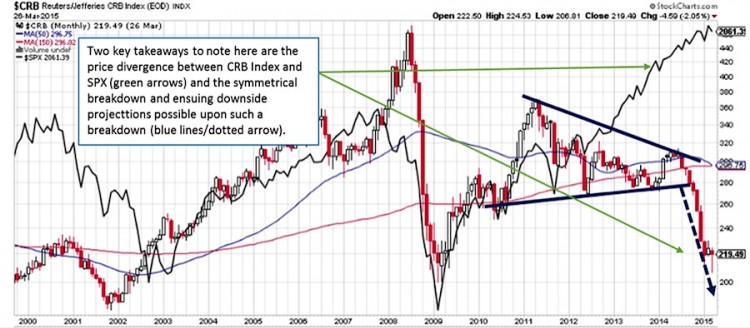
Cutting to the chase, there is not yet enough technical evidence to suggest that this “bust” cycle is over, in my opinion. In fact, it has touched a lower low this month (206.81) as it surpassed its January 2015 low (211.27). So, despite 8 of 9 months of steady declines, I have yet to see any “broad” healthy basing effort or cycle ending capitulation.
So let us revisit the question of “How low is low?” Based on the multi-year symmetrical triangle breakdown noted in the chart below, one could render downside projections to test the 2009 low (200.16) or even to overshoot in a capitulation or panic selling bottom. In order to pick up signs of stabilization, I would like to see at least a successful test of the March 2015 low, followed by a period of consolidation or backing and filling. Another scenario could be that the CRB Index has not reached bottom and needs to wash out the bulls, flush a bottom, and then recover. In hindsight, some investors and traders prefer the latter scenario, which is the equivalent of ripping off the Band Aid as opposed to the drawn out process of a painful sideways trending market. In either event, this is how I am viewing the coming weeks/months.
Chart 1: Is there more downside to the commodity bust?
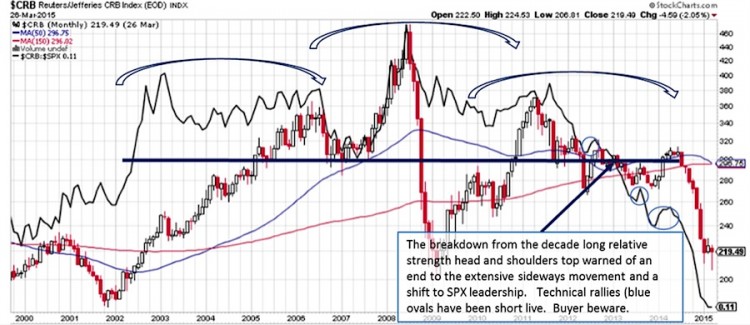
Now, let’s touch base on the relative strength comparison between the CRB Index and the S&P 500 as this is surely to have some, however small, impact on one’s strategic asset allocation decisions. This simple relative strength chart can be read as follows: A rising (black solid) line denotes an outperforming CRB Index vs. the S&P 500, while a decline line shows the S&P 500 outperforming the CRB Index. Take note on the next chart how the violation of this decade long, and rather nasty, head and shoulders top pattern broke neckline support back in early 2012, and thus confirmed that a the years of sideways relative strength trading has ended and that the S&P 500 has emerged as a relative strength leader. As with the price chart, there are no signs, at least from a technical perspective, of any kind of reversal. In fact, see the chart below and the highlighted circles of the handful of brief periods of commodity outperformance and how each was followed by the resumption of the downtrend. What this means is that one must be wary of such bounces until evidence builds of a meaningful recovery. Remember, this is a “show me” market and that investors will not likely be easily swayed.
Chart 2: How asset allocation comes into play
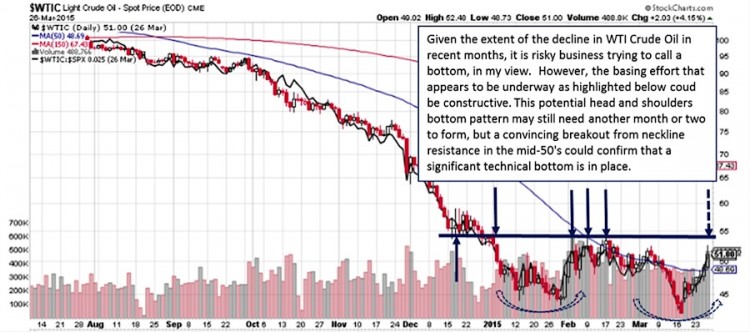
Lastly, given the sharp bounce of late in WTI Crude Oil, some are sure to tell me that we have hit bottom in this cycle already. In order to handle any questions regarding my thoughts in a separate post, here are my thoughts and below is my chart on the subject.
Given the extent of the decline in WTI Crude Oil in recent months, it is risky business trying to call a bottom, in my view. However, the basing effort that appears to be underway as highlighted below could be constructive. This potential head and shoulders bottom pattern may still need another month or two to form, but a convincing breakout from neckline resistance in the mid-50’s could confirm that a significant technical bottom is in place.
Chart 3: Before you ask – my chart analysis on WTI Crude Oil
As a personal disclosure, I do not own or have a direct financial interest in any security mentioned. Although I am affiliated with T3 Trading Group LLC, opinions reflected are my own and should not be considered as investment advice.
Follow Jonathan on Twitter: @jbeckinvest
Any opinions expressed herein are solely those of the author, and do not in any way represent the views or opinions of any other person or entity.


