First some facts about the July stock market calendar range.
The July Pattern
The Six-Month Calendar Ranges
- Provides directional bias for the next 6 to 12 months.
- January and July divide the year
- Simple levels that matter + the right indicators and tactics.
Overall, we look at 2 simple things.
- If an instrument breaks out of the range or breaks below with momentum and price and then has follow through.
- If an instrument breaks out or down and then reverses back into the calendar range high and low.
In the case of Russell 2000 ETF (IWM) and Retail Sector (XRT), both instruments closed above the calendar range high (green horizontal line).
Both IWM and XRT are outperforming the benchmark.
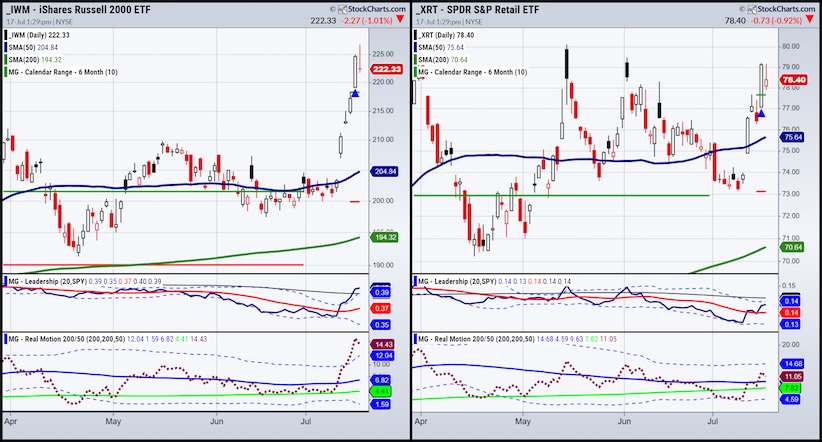
And both have good momentum in our Real Motion indicator, however, IWM is stronger than XRT.
Side note-the inverted doji candle on the IWM chart is quite pretty. Generally, that means a lot of forced selling.
And here are the reasons why:
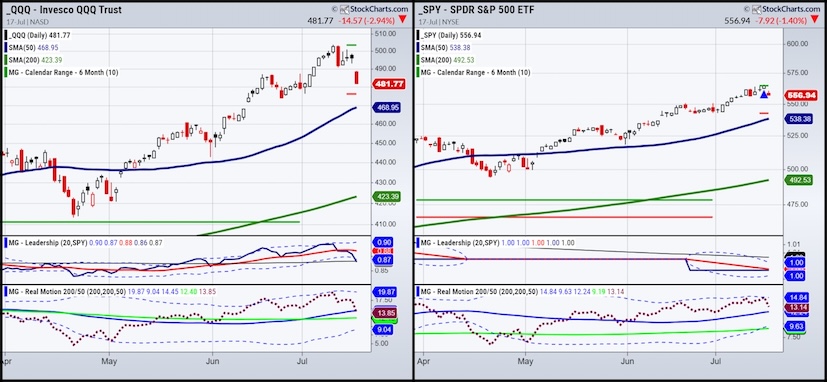
Looking at the chart of NASDAQ and the S&P 500, we see a different picture.
QQQs not only failed to clear the July range high but is close to the July range low.
QQQs are outperforming SPY.
And the momentum indicator shows that this move could be overdone as the dots landed right on the 50-DMA.
SPY also failed to clear the July range high.
Yet, SPY is far from the July calendar range low.
Momentum, like QQQs, remains intact.
That tells us that the small caps and retail could easily continue to lead the market up or at least outperform the QQQs and SPY.
And it is also possible that should QQQs and SPY fall further, IWM and XRT will also trade lower.
Then, we will watch for any failure of the July range high.
For now, it seems that QQQ and SPY are overdone.
And if so, we expect IWM and XRT to continue to either consolidate at these levels or have another leg up.
Remember, 227 in IWM is the last gasp high from January 2022 and is an important level.
Every instrument has put in a July 6-month calendar range currently.
Which means, with a new bifurcation in the overall market, it is important to know where the calendar range sits in any instrument.
To find out more about calendar ranges, momentum and leadership indicators, please contact Rob Quinn, our Chief Strategy Consultant,
Twitter: @marketminute
The author may have a position in mentioned securities at the time of publication. Any opinions expressed herein are solely those of the author and do not represent the views or opinions of any other person or entity.


