The current rally on the S&P 500 may be targeting higher prices yet. Why do I say that? Because that’s what my Fibonacci method is telling me. Let’s look at some charts.
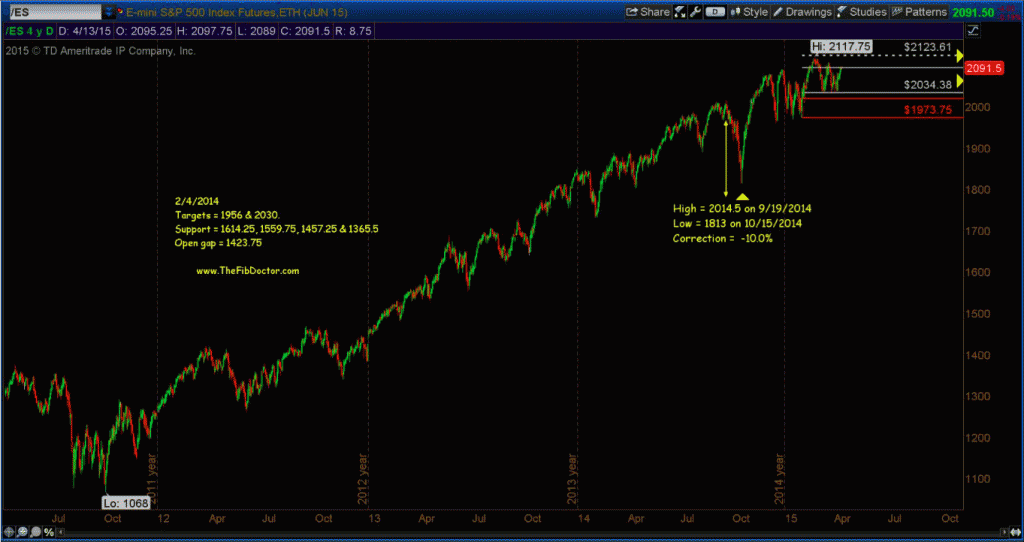
Below is a longer term, daily chart of the S&P 500 E-Mini contract (ES) I’ve used for acquiring longer term targets starting back in 2010. All the upside targets have been hit and closed except for the current one at 2123.50, which I fully expect to be hit.
S&P 500 E-Mini (ES) – 4 Year Daily chart
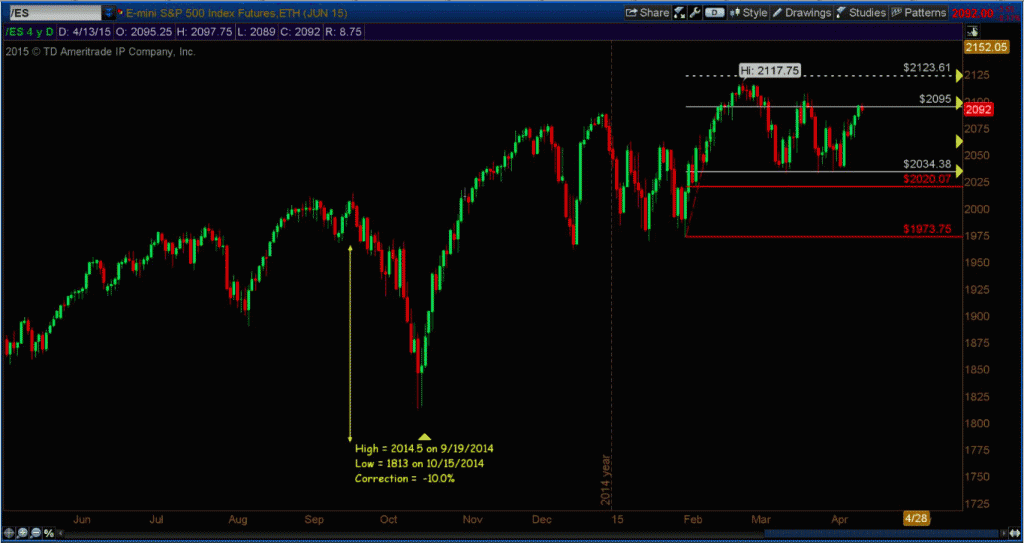
Now a tighter view of the same chart with a few support levels to be aware of.
S&P 500 E-Mini (ES) – 1 Year Daily chart
Note the following from the chart above:
- Support levels are 2034.50 and 2020.25
- 2034.50 support has been tested and held
- A “W” pattern is forming confirming my belief that the 2123.50 target will be hit.
Thanks for reading and remember to always do your homework and use a stop when trading!
Follow Dave on Twitter: @TheFibDoctor
No position in any of the mentioned securities at the time of publication. Any opinions expressed herein are solely those of the author, and do not in any way represent the views or opinions of any other person or entity.


