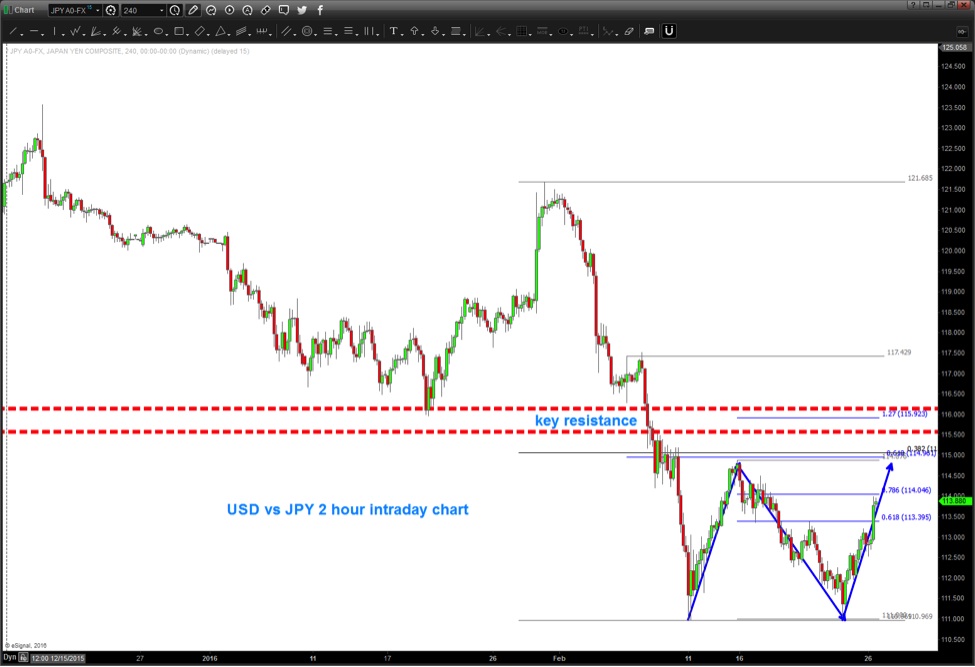
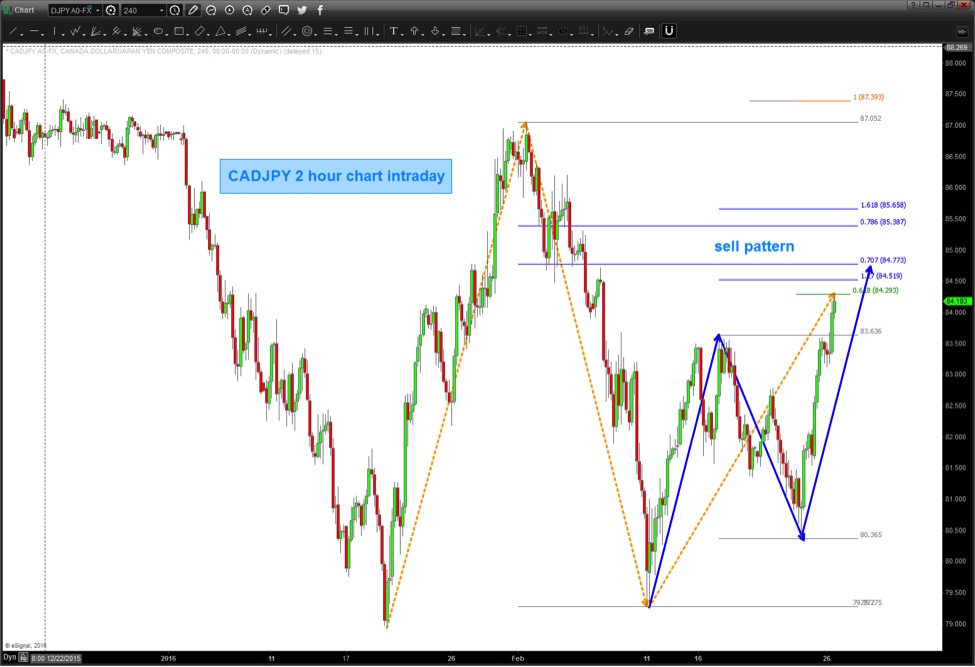
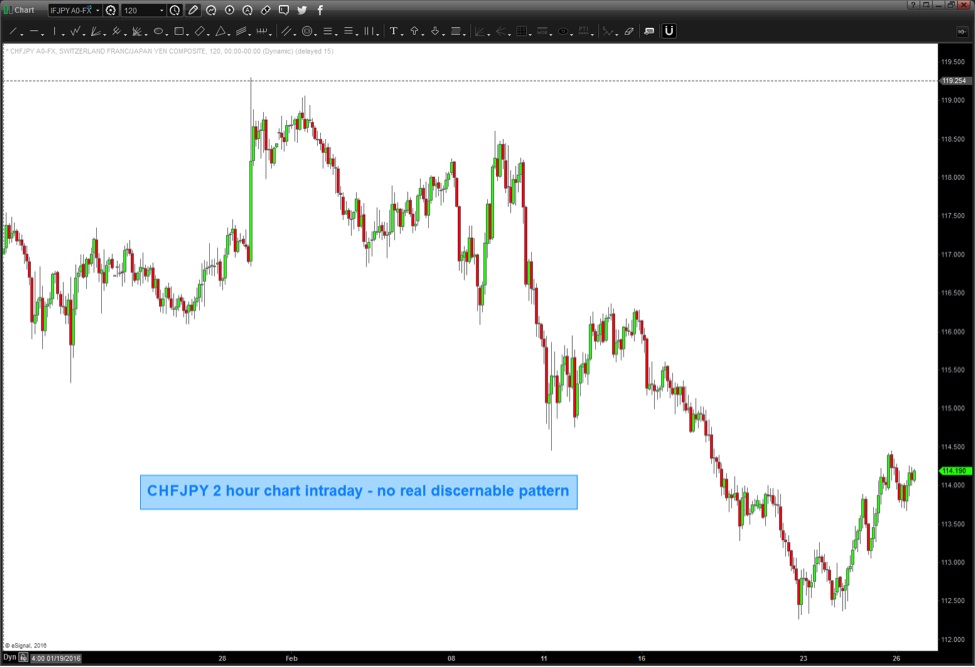
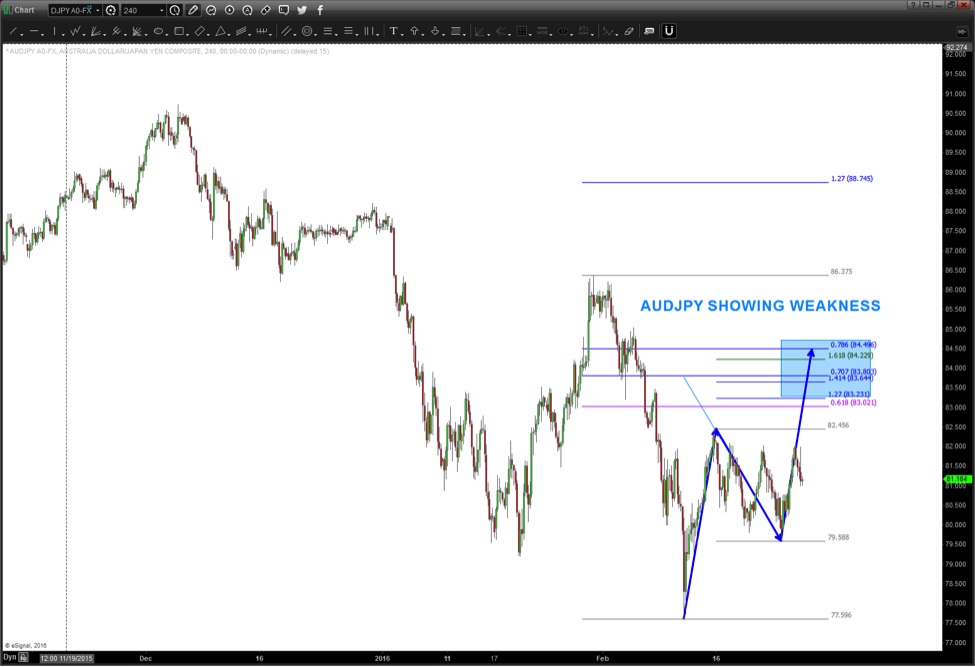
The other thing we want to take into account is the strength of the YEN versus the cross rates. If the Japanese Yen is to strengthen, then we’ll look for patterns that support this thesis. Several forex cross pairs charts are included below:
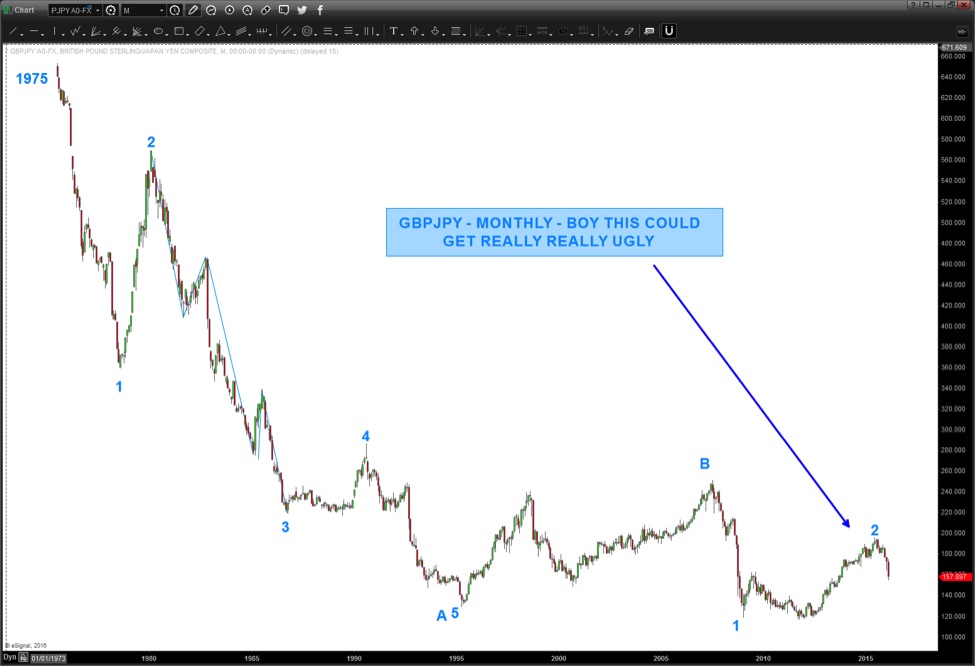
This chart of the GBPJPY below – iF CORRECT – could get really ugly.

One last look… take a look at the Nikkei 225 continuous futures contract. Again, is the correction complete OR do we have a “b” wave up and then a smashing C wave?
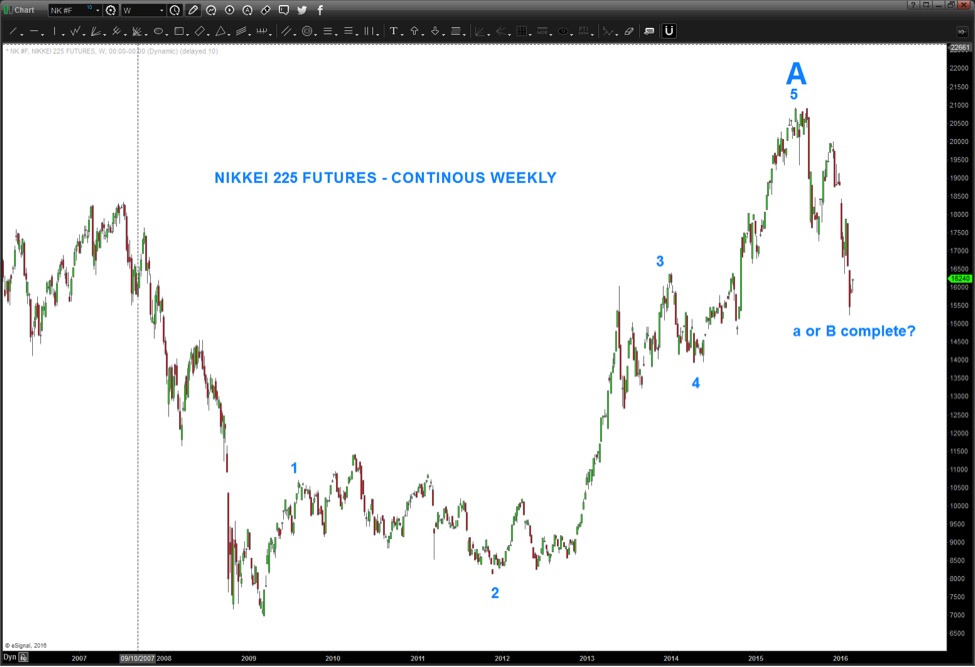
So, in summary, we are at a pivotal point for the Japanese Yen. We are either complete with the correction and the Yen beings to weaken even more than it has over the past 4 years OR we have another move up followed by a smashing C wave to complete the correction. Believe the upcoming price action noted above in/around 116 on the USDJPY will give us our first clue.
Thanks for reading.
Further reading by Bart: “Consumer Staples Relative Strength Nears Extreme“
Twitter: @BartsCharts
Author does not have a position in mentioned securities at the time of publication. Any opinions expressed herein are solely those of the author, and do not in any way represent the views or opinions of any other person or entity.
: Creating Bullish Divergence?")


 and Semiconductors (SMH): Concerning Price Pattern?")


