Some inflation data points for you to ponder:
– Inflation is running hot at 5.4%.
– The unemployment rate less “quitters” is 1.9%.
– QE is still running full throttle at $120 billion a month.
– The Fed will not even think about raising interest rates until QE ends.
If you do not think inflation can be persistent, think again.
The Fed repeatedly tells us the rationale to keep the monetary pedal to the metal is a weak labor market. The graph below calls their logic into question.
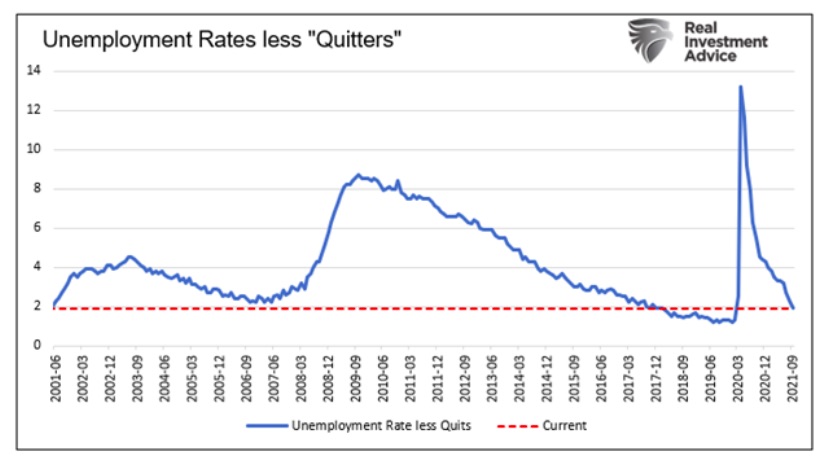
Quitters are defined as those leaving jobs voluntarily and, in theory, in search of better or higher-paying jobs. The current quit rate of 2.9% is the highest in its 20-year history. A high quit rate is a signal of a healthy labor market.
It is not just high inflation and a strong labor market forcing prices high. We must also factor in supply line difficulties and shortages of many goods and commodities.
It is time we best start thinking outside of the stable inflation box. The inflation environment most investors are very comfortable with may be collapsing.
As we have seen for the past few weeks, equities are becoming sensitive to the rising possibility of persistent, not transitory, inflationary pressures. As such, it is worth revisiting equity analyses we shared in May 2020.
The Specter of Inflation
In May of 2020, we wrote the following: “we raise the specter that inflation may result from the synchronized combination of a variety of factors, including surging money supply, fractured supply chains, and in time, economic resurgence.”
All three factors are now resulting in rising inflation. In mid-2020, no one thought supply line problems and product shortages would linger for over a year. As a result, few economists foresaw inflation running hot for such a long period.
The Fed is starting to acknowledge this bout of inflation may last longer than a “transitory” period. Per Atlanta Fed President Raphael Bostic, “U.S. inflation is broadening, not transitory.” His statement is the first recognition from a Fed member that higher inflation may no longer be transitory.
He started that speech with the following: “You’ll notice I brought a prop to the lectern. It’s a jar with the word “transitory” written on it. This has become a swear word to my staff and me over the past few months. Say “transitory,” and you have to put a dollar in the jar.”
Investors Prefer Stability
Equity investors should be willing to pay a premium for price stability. Price stability makes corporate forecasting more reliable, allowing executives to manage expenses better and ultimately increase profitability.
To understand why let’s buy a pizza shop. As a potential owner, wouldn’t you be willing to pay more if you knew worker wages, rent payments, and the prices of dough, sauce, cheese, and pepperoni will be constant for the next ten years? Price stability allows for better order management enabling the owner to manage costs efficiently. As a result, the pizza shop can be more profitable.
Equity investors like price stability for the same reason the owner of a pizza shop does. Since the 2008 Financial Crisis, equity investors have been treated to a healthy dose of price stability.
The orange line below charts CPI since 1948. The blue line shows the running one-year standard deviation or volatility of inflation. Before the pandemic, CPI’s standard deviation was near the lows of any period in the last 70 years (dotted red line).
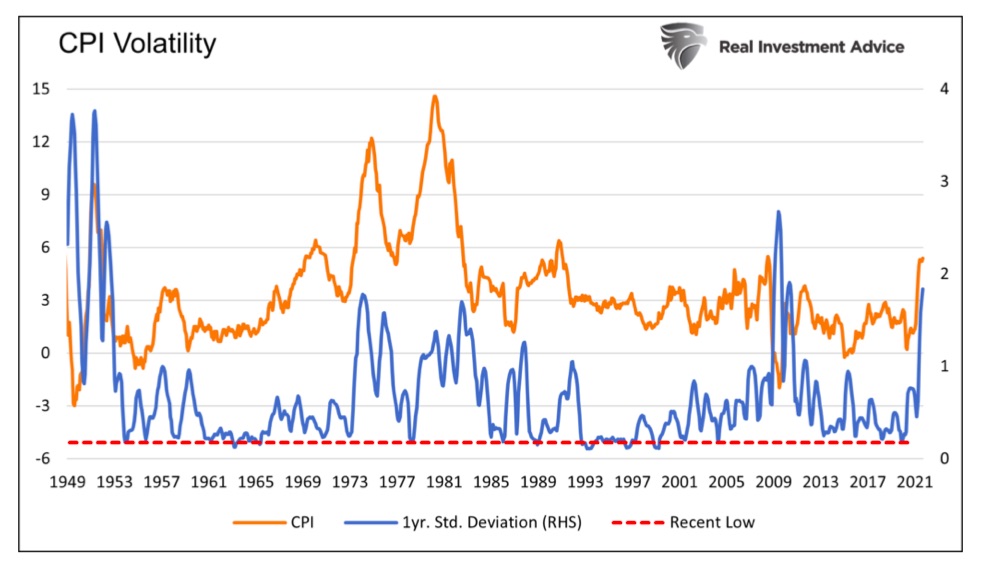
As we show, with the recent spike in price volatility and 5.40% inflation print, investors should not be so confident of the future. Price behavior of the last year looks nothing like the last ten. That said, there are numerous other periods over the previous 70 years with similar sharp rises in inflation.
The graph below shows investors are willing to pay a premium when inflation is in the sweet spot. As shown, valuations are highest when CPI runs above 1% and below 4%.
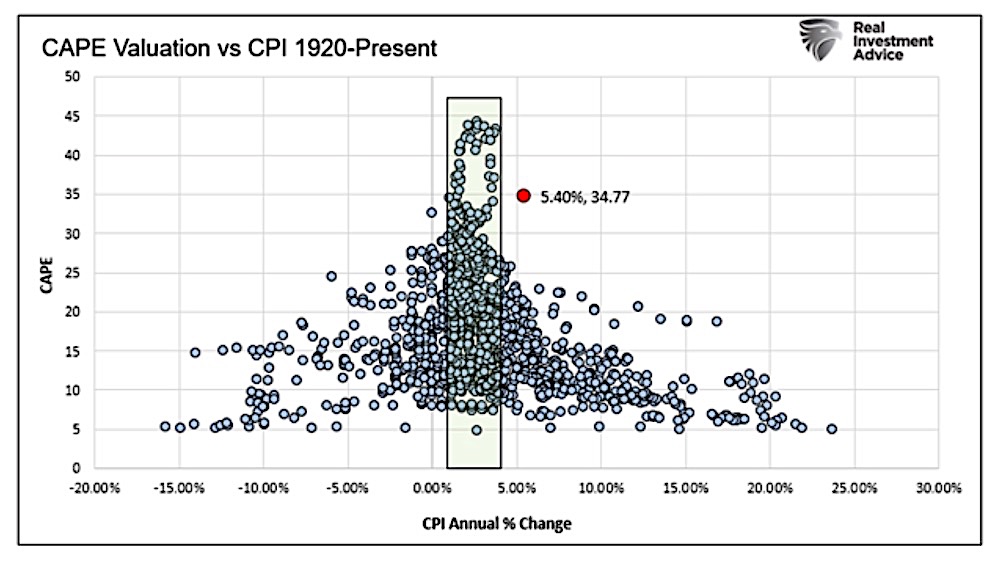
Before today’s instance in red, the highest CAPE occurring when inflation ran between five and six percent was 22.42. At 34.77, the S&P 500 would have to fall 36% to match that high.
There are two considerations to explain today’s extremes valuations. Either investors do not care anymore, or they believe higher inflation will not last. If it is the latter, we best have a plan if they are wrong.
What if Inflation is Persistent?
Given the uncertainty, we should strategize around an array of inflation options. One of those options is not just high inflation, but crippling stagflation like the 1970s and early 1980s.
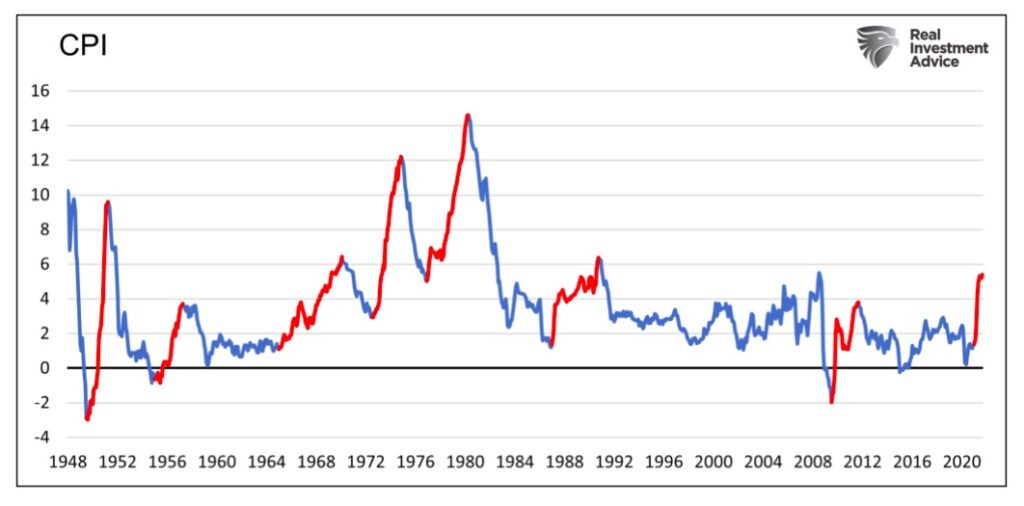
In The Crosscurrents of In/De-flation Part 2, we assess seven prior inflationary periods of the last 75 years to gauge how different industries and sectors perform in various inflationary environments. The graph below highlights those periods and their respective levels of inflation. We highlight the current period as well.
The bar graph below shows cumulative returns for each industry if you only held each sector during the inflationary periods.
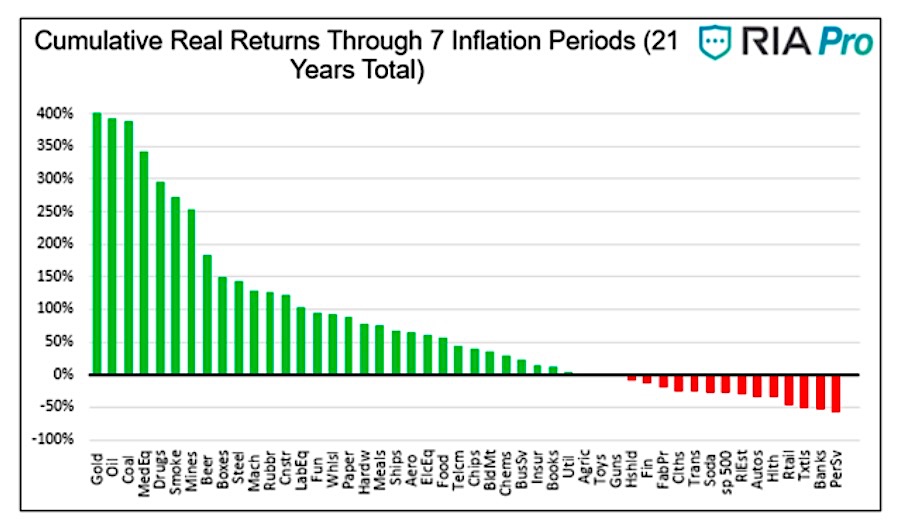
Materials, drugmakers, and commodity companies tend to do the best in inflationary environments. On the flip side, the S&P 500 is in the red, as are financials, transports, retail, and real estate. Roughly two-thirds of the industries had a positive performance.
The vast amount of data behind the graph is mixed. We do not show that performance for most industries is abysmal during the high inflation spikes of the 1970s and early 1980s. In most other inflationary cases, stocks hold their own, at least on a nominal basis.
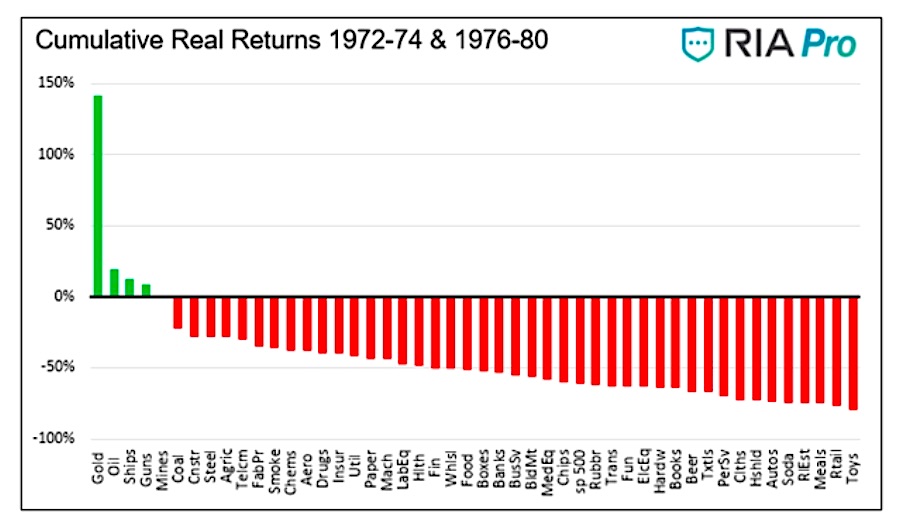
Next, we look at the two periods with double-digit inflation, the 1970s, and early 1980s. The graph below shows only gold, oil, ships, and guns produce positive returns. Everything else is in the red. In those two environments, the S&P fell over 50% cumulatively.
Profit Margins Matter
Inflation tends to shrink profit margins and is, therefore, a critical factor in forecasting stock prices. Below we share a proxy for profit margins using total corporate profits as a percent of GDP. Our data is closely aligned with data from Standard and Poors but covers a more extended period allowing us to analyze all seven inflationary periods.
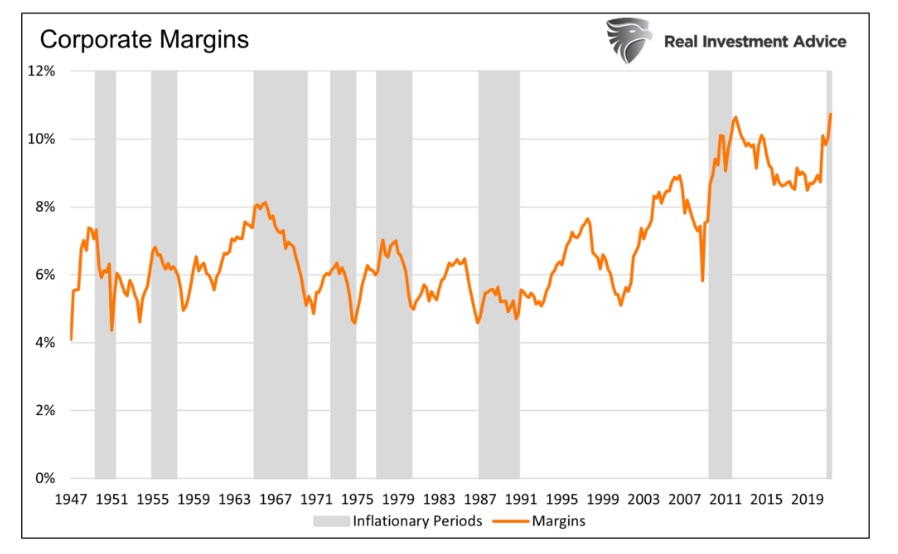
In six of the seven inflationary periods, including both episodes in the 1970s, corporations experienced margin compression. The era of moderate inflation, following the 2008/09 recession, was the only period where margins improved.
Profit margins are now at their highest levels since at least 1947. If inflation continues higher and margins decline, profits will suffer. Now recall the graph we shared earlier with valuations. If earnings decline due to declining margins and valuations fall to levels in line with prior periods of inflation, stocks could easily fall by 40-50%. Even more significant declines would not be abnormal.
In the event of persistent inflation, stocks that can protect margins that are not trading at high valuations have the best chance of retaining their value. Conversely, beware of those trading at high margins with limited ability to pass on higher costs to consumers.
Conclusion
We still maintain a deflationary bias longer term. That said, we do not know what the future holds, nor does anyone else. It is not a given anymore that supply lines will moderate, and inflation will normalize in a short while. Workers are becoming more emboldened to seek higher wages, threatening a wage-price spiral.
The Fed is running policy as if the economy were in a depression when it is booming. More inflation is probable, at least in the short run, and we best appreciate how inflation can wreak havoc on stock prices.
Given record profit margins and valuations, there appears little upside, especially if inflation remains problematic. Throw stagflation into the formula, and the outlook is bleak.
We urge you carefully consider the risks and rewards in various inflation environments and trade accordingly. This time is different!
Twitter: @michaellebowitz
The author or his firm may have positions in mentioned securities at the time of publication. Any opinions expressed herein are solely those of the author, and do not in any way represent the views or opinions of any other person or entity.

