Do you like big bullish bases for stocks? How about breakouts?
Motorola Solutions (MSI) fits this criteria for me.
Today, I’ll look at both the weekly and monthly chart to show why Motorola Solutions could be a great longer-term play for growth investors.
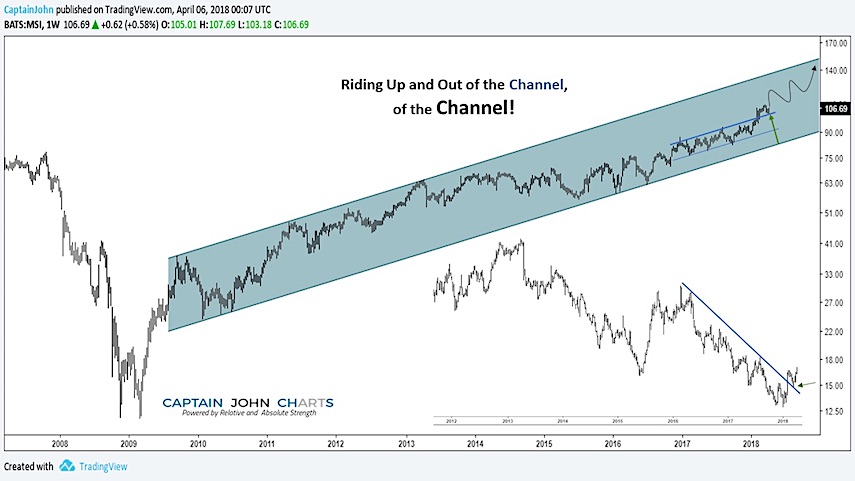
In the weekly chart below, Motorola Solutions stock price is breaking out of an “inside” channel that is nested within a larger rising channel. This could lead to a test of the upper (larger) channel.
Relative to the Semiconductor ETF (SOXX), it has broken out and confirmed a turn higher.
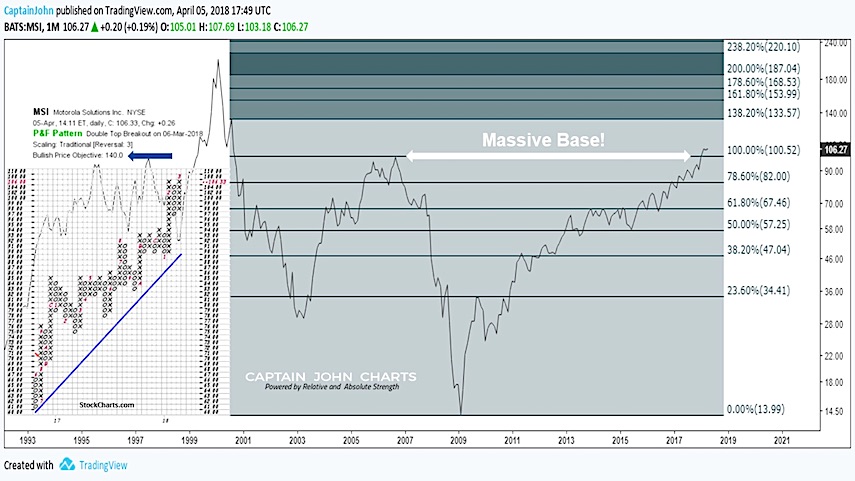
On a monthly chart, Motorola Solutions $MSI has taken out the 2006 highs with follow through. The next price target would suggest the low 130’s near the 138.2% Fibonacci price extension.
Point & Figure analysis has a price target in the ~140 area longer-term for $MSI.
If you are interested in learning more about our investing approach and financial services, check out Captain John Charts.
Twitter: @CptJohnCharts & @FortunaEquitis
The author may have a position in mentioned securities at the time of publication. Any opinions expressed herein are solely those of the author, and do not in any way represent the views or opinions of any other person or entity.


