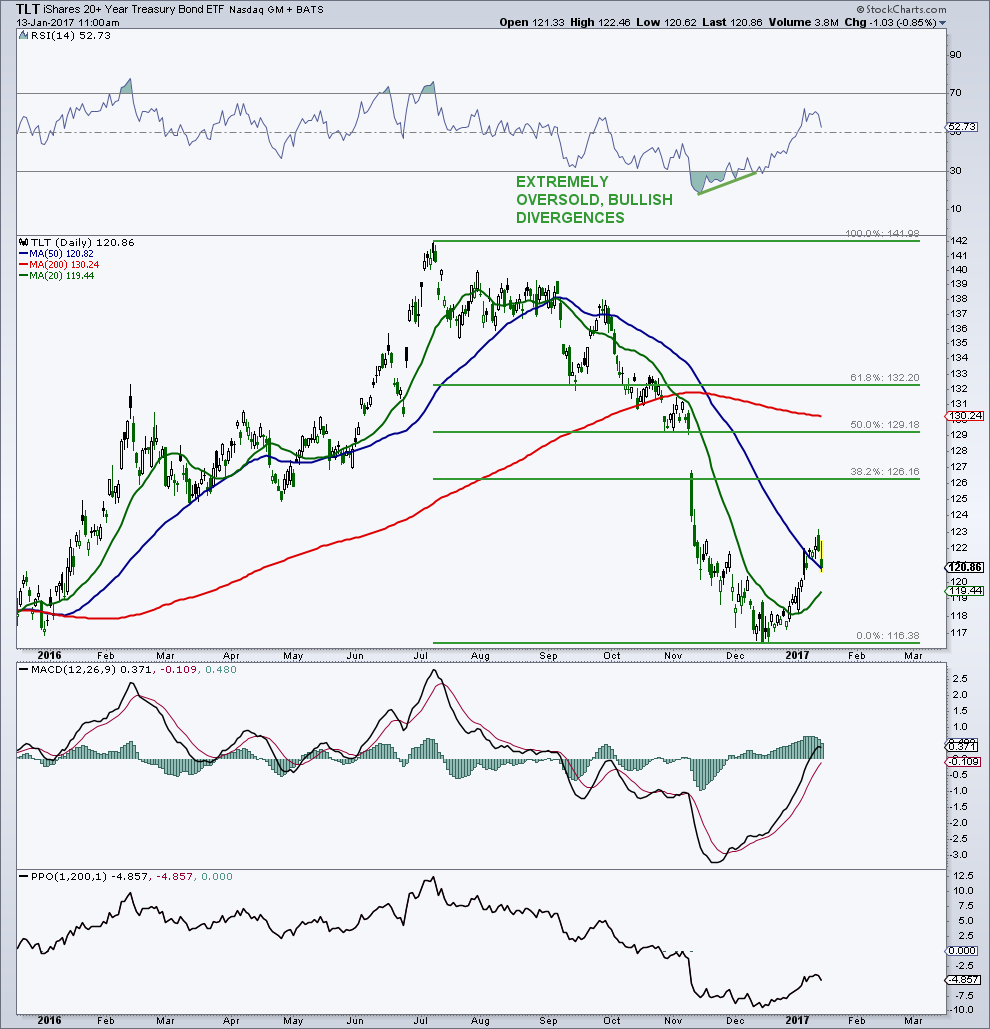
During the summer, I put out a lot of very bearish commentary about the Treasury market. There were numerous technical reasons for the call. In addition, and I know it seems so long ago, was this almost universal opinion that yields on the long end of the curve were going to zero. Wow, have things changed.
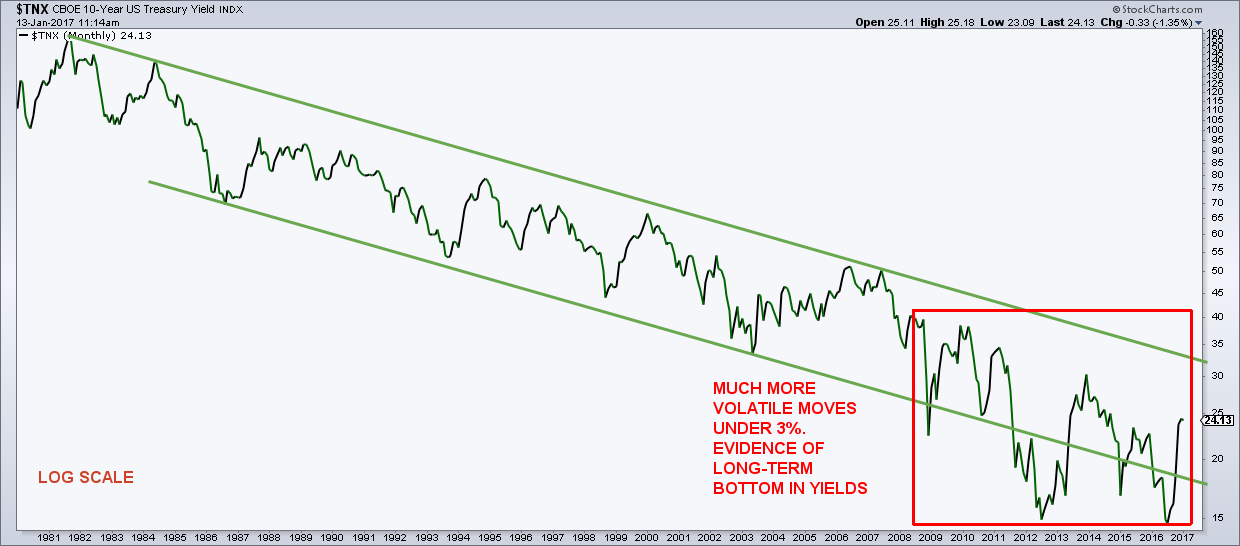
After the dump into the December low, now the universal opinion is that yields have ended their 3 decade plus bull market and are heading much higher. Funny thing is, yields remain in a long-term downtrend.
While there is evidence that a long-term bottom in yields is being traced out, the 10-year needs to clear 3%+ to end this pretty consistent and extremely long downtrend in rates.
I hope you have already gotten my point here. Wild swings in market sentiment are directly correlated with any asset price. During the summer, when global yields were going negative, and bonds were ripping higher, sentiment was obscenely bullish. During the latest correction, and it was nasty, market sentiment went to the other extreme. This ebb and flow in prices and the associated swings in sentiment is so predictable its laughable.
10 Year Treasury Yield Chart – Long-Term View
20+ Year Treasury Bond ETF Chart (TLT) – Near/Intermediate Term View
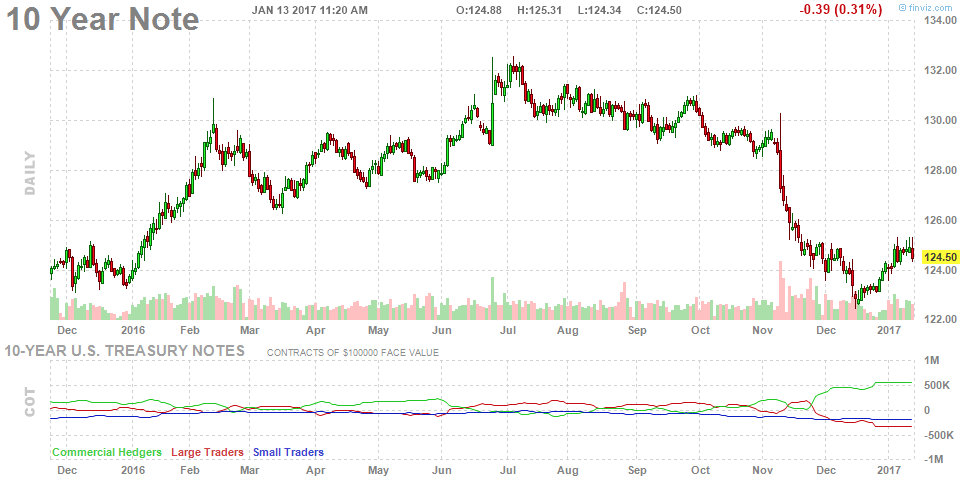
What has really caught my attention for treasuries is the fascinating story being laid out by the Commitment of Trader’s (COT) report. Talk about a WOW moment and it’s potential implications.
Commercial hedgers – the smart money, have recently gotten very, very bullish on the 10-year treasury. As the World turned bearish on bonds, the smart money is once again going the other way. Commercials have increased their net futures position in the 10-year by 689,249 contracts since July. The last time commercials increased their positions in the 10-year by this much and in rapid fashion was in the latter part of 2007 into early 2008. That corresponded with an almost 20% rally in the 10-year treasury. We also saw a similar move by commercials in late 2004/early 2005 which did not lead to higher prices but generally flattish prices. I will also note that large speculators – the not so smart money, are as bearish as they have ever been. While it’s hard to see, the smart money commercials were very bearish on a relative basis back in July while large speculators were very bullish. This coincided with the summer peak.
10 Year Treasury Note COT Chart
So if the commercial hedgers are right again and the large speculators as well as the investment community consensus is wrong again, and Treasuries see an outsized rally in the months ahead, what are the investment and economic implications.
This is where it gets really interesting. The overriding consensus is that the economy gets better from here on out, mainly due to Trump’s pro growth policies. Hey, lower taxes, less regulations sound great and its hard to argue with. However, a large Treasury rally implies weakening economic growth, not a pickup. What else? The most loved sector on the Street is financials. Why? The recent rally for sure as price has a way of moving the sentiment needle, the universal assumption that interest rates on the long end are heading higher now (wider yield curve helps banks), and of course, less regulation. Well, what if part of that bullish pillar gets taken away, and rates head lower and the yield curve flattens. Not good for the banks.
Thanks for reading. Reach out to me at arbetermark@gmail.com for inquiries about my newsletter “On The Mark”, if interested.
Twitter: @MarkArbeter
The author has a small position in TMF (3X bullish treasuries ETF) and GDXJ (junior miners ETF) at the time of publication. Any opinions expressed herein are solely those of the author, and do not in any way represent the views or opinions of any other person or entity.


