The last year has been a rough one for Crude Oil prices. I suspect that consumers are enjoying the benefit of crude oil prices, as the decline has brought some relief at the pump… especially as we approach the holidays. Everyone enjoys having a little extra jingle at this time of year.
But the winds may be changing. At least, it’s possible that crude oil prices move higher over the near-term.
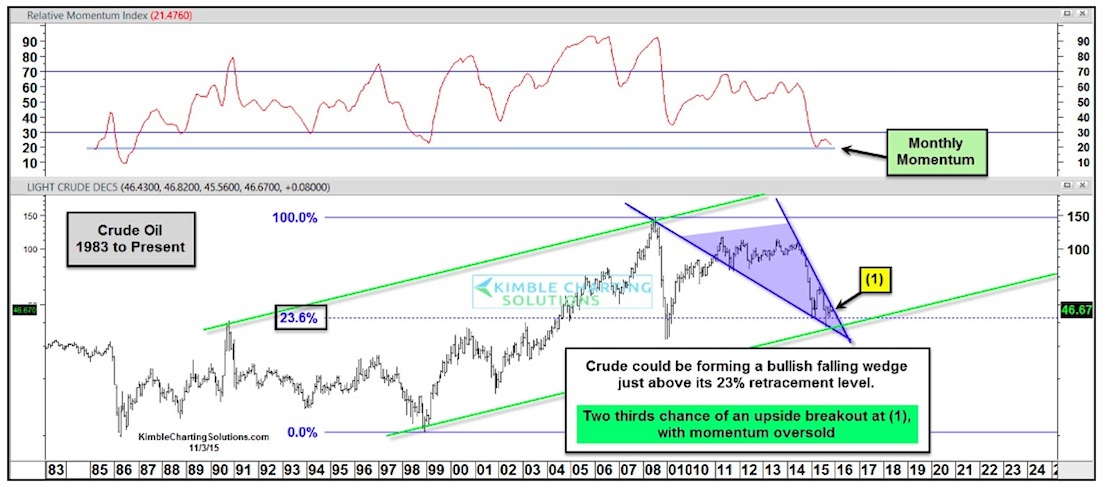
In the chart below, you can see that crude oil is forming a bullish falling wedge pattern, with the point of the wedge close by its 23 percent Fibonacci retracement level. It is also near the multi-year bullish rising trend support.
One other note: take a look at the monthly momentum indicator. It is approaching levels rarely over the past 30 years.
So what do we watch for? Support is clear and bulls don’t want that level to break. On the upside, if Crude oil prices break above resistance at (1), buyers could push prices upward.
Crude Oil Prices – 30 Year Chart
Thanks for reading.
Twitter: @KimbleCharting
Any opinions expressed herein are solely those of the author, and do not in any way represent the views or opinions of any other person or entity.
 Nearing A Bottom?")

?")


 Nearing A Bottom?")