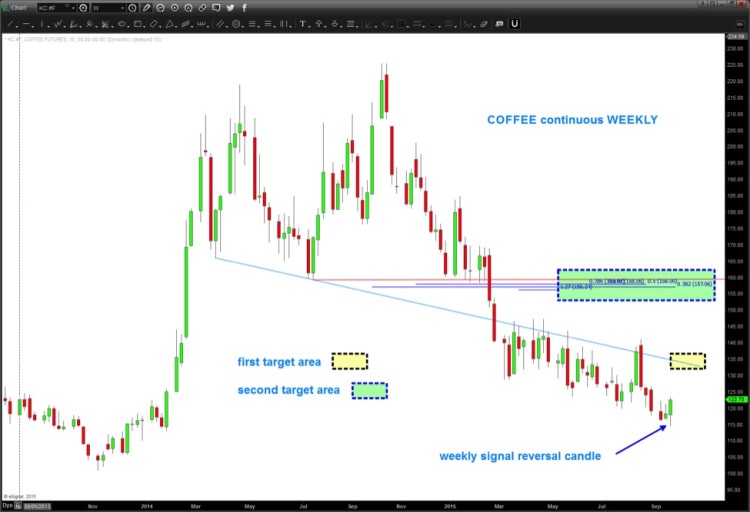
Almost all commodities have been hit hard over the past year. Today, I’d like to chart Coffee Futures and share an interesting risk/reward setup on the charts.
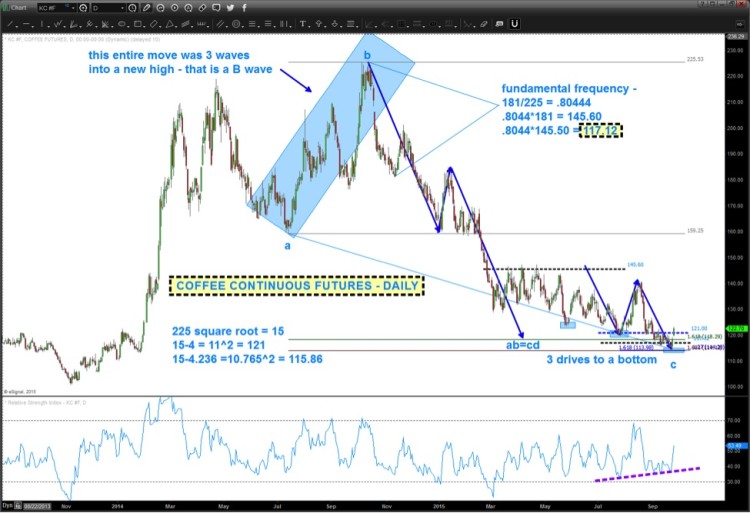
The bullish case for coffee futures has to do with its wave structure over the past 2 years. And, to be more precise, what “appears” to be a 3 wave move to a new high last year (see chart below). IF prices have moved in line with my current structure, then probability says that the down move over the past year has been corrective in nature.
And this could be setting up for a nice rally and trade higher.
Based on the big gap up last week and the fact that a “lot” of math and geometry are pointing to the recent lows as important, it’s fair to assume that coffee is off on a move higher.
The Risk here is the most recent lows – anything lower than that and I’m throwing in the towel on a bullish case for coffee!
Continuous Coffee Futures – 2 Year Chart
Here’s a chart showing the “math” for the potential low in coffee prices:
I have been looking for a low and a rally higher in coffee prices for a little while… here is another chance to get long Coffee. Again, this analysis would be totally wrong if continuous coffee futures drop below the most recent low.
Thanks for reading.
Twitter: @BartsCharts
Author does not have a position in mentioned securities at the time of publication. Any opinions expressed herein are solely those of the author, and do not in any way represent the views or opinions of any other person or entity.


