Most traders live and die with price charts. They show us where to buy and where to sell. Many times a securities price leaves us a clue on a chart as to where it will head next.
Today we will look at Bitcoin and highlight its yearly price pivots.
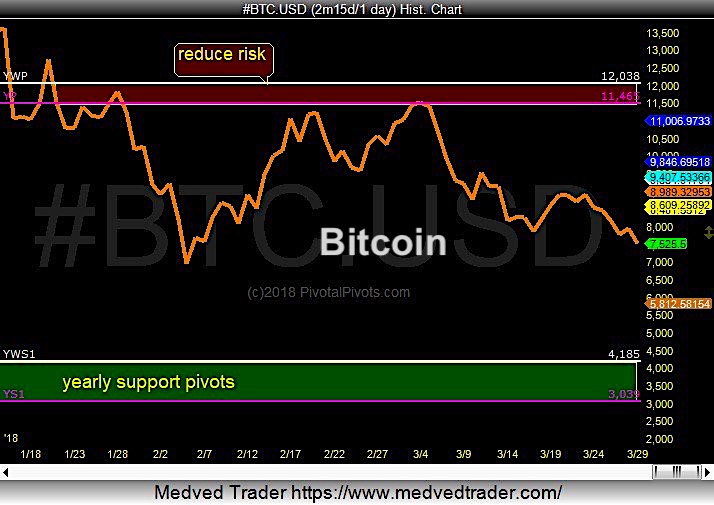
Looking at the Bitcoin $BTCUSD chart below, we can see that the Yearly pivot (YP) is at $12,000. That level has served as strong resistance ever since Bitcoin fell through it… note that price has been rejected there a few times.
When this happens, price usually falls to the Yearly S1 pivot points.
Therefore, there is a good chance that Bitcoin will fall in 2018 to the Yearly S1 pivot points at $4200-$3000, as long as it stays below the yearly pivot at $12,000 (YP).
Bitcoin Chart with yearly pivot points
The indicators that I use on my price charts are called Pivot Points. It’s a mathematical calculation based on the previous periods high, low and close.
Know In advance where these key Pivots are at on Pivotal Pivots or catch me on Twitter.
Twitter: @Pivotal_Pivots
The author may have a position in mentioned securities at the time of publication. Any opinions expressed herein are solely those of the author, and do not in any way represent the views or opinions of any other person or entity.


