I’ve been involved in and out of Akamai Technologies (AKAM) for the better part of the last 17 years. There was a time when anything positive I’d say would have to be backed up by a long explanation of why there was a whole lot more to AKAM’s story than just being a “dumb bandwidth” reseller. That story is now clearly out there so I will stick to a few comments on the price action based on DeMark indicators.
On a daily basis the stock price is approaching the “Risk Level” at $75.02, and this comes off the latest TD Sequential Countdown Sell. The Countdown Sell signal expired (after 12 bars) without having any effect on the trend, which has now resumed to the upside. If the “Risk Level” mentioned above is violated on a “qualified basis”, the stock should have more room to the upside.
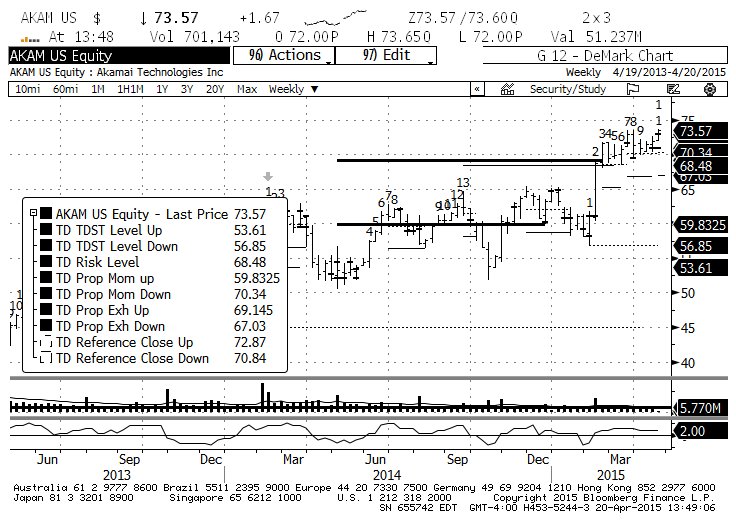
On a weekly basis (chart below), there is an active TD Sell Setup signal in place, so we should expect a pause/pullback within 1-4 bars. But we don’t know how deep of a pullback we’ll get if one occurs.
Akamai Stock Chart (Weekly)
On a monthly basis, the count is only on bar 3 of a TD Sell Setup and price has broken the TDST Level Up on a qualified basis, which calls for reaching full Sequential Countdown after the TD Sell Setup completes. This bodes well longer term for Akamai investors (in my humble opinion).
Bottom line: DeMark indicators suggest that AKAM is near levels (Risk Level at $75.02, and monthly TD Relative Retracement at $78.95) where it should consolidate for a few weeks, but the monthly chart argues that long term buyers are very early in the accumulation process.
Keep in mind that Akamai Technologies reports earnings on 4/28. In full disclosure, I have an interest in AKAM and have rolled my May 62.50/75/90 call fly into the Jan’16 75/90/105. Thanks for reading.
Follow Fil on Twitter: @FZucchi
The author is long AKAM calls at the time of publication. Any opinions expressed herein are solely those of the author, and do not in any way represent the views or opinions of any other person or entity.


