The stock market has climbed back to (or near) all time highs with several stocks making new highs. However, one stock that is missing from that list is Chipotle (CMG). And this shouldn’t be a big surprise as I highlighted a potential Chipotle stock top in early February.
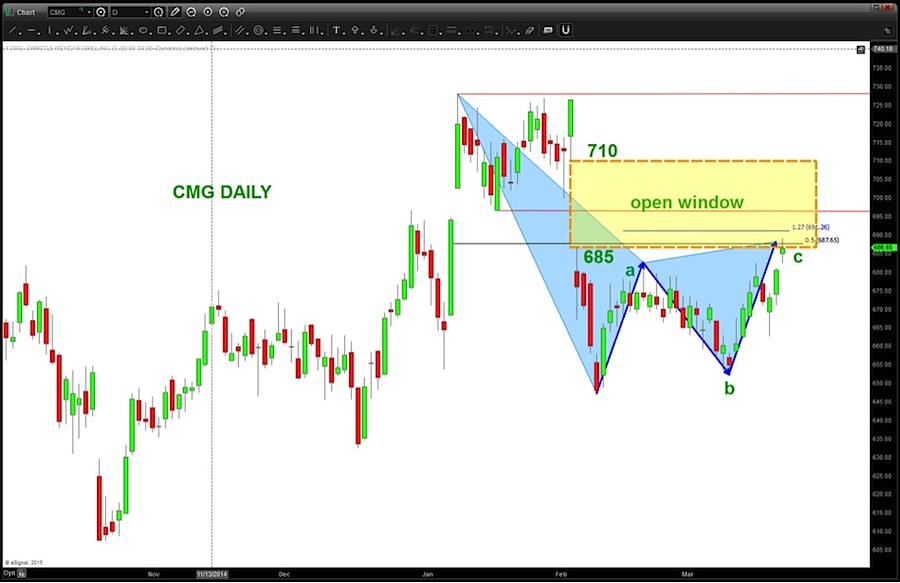
At the time of that post, CMG was in the midst of a sharp decline. But since then, Chipotle’s stock has completed a typical 3 wave correction (labeled a-b-c). Note that the corrective move higher has taken CMG right back up and into the open window of 685-710. If a Chipotle stock top is in the works, this resistance level should hold as resistance.
With this pattern (shown by the blue shaded triangles) complete, CMG “should” start down for another bearish leg. And as noted above, the 25 point window (yellow fill with orange outline) should act as stiff resistance to any rally.
Chipotle (CMG) Daily Chart
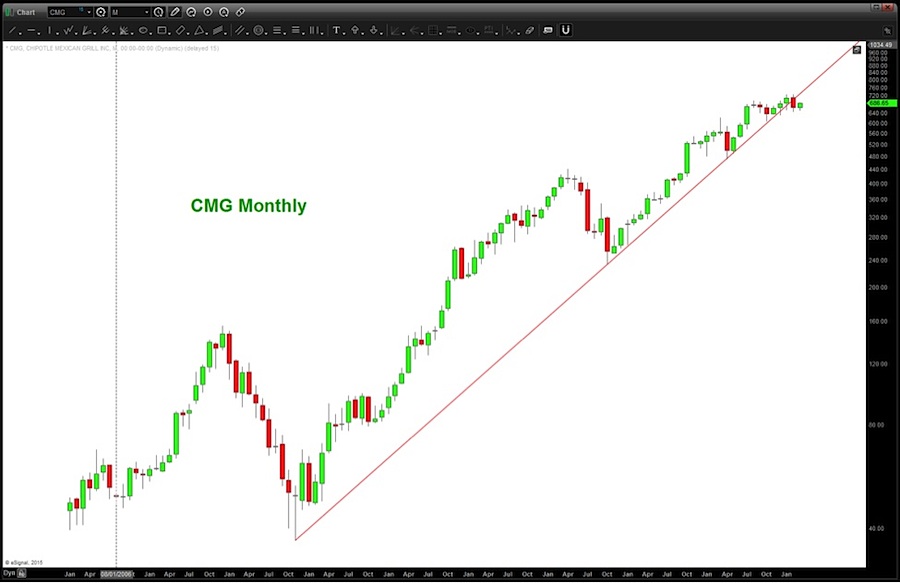
Below is an update on the long term monthly chart and trend line (log scale)… as you can see, last month represented the first time in the history of CMG that the stock has CLOSED below the long term log trend line. This is significant and “bears” watching.
Chipotle (CMG) Monthly Chart
When a trend line breaks it often warns of the potential for a topping process (on any time frame). The coming weeks will be important to monitor as price attempts to carve out a Chipotle stock top.
Thanks for reading and have a great week.
Follow Bart on Twitter: @BartsCharts
No position in any of the mentioned securities at the time of publication. Any opinions expressed herein are solely those of the author, and do not in any way represent the views or opinions of any other person or entity.


