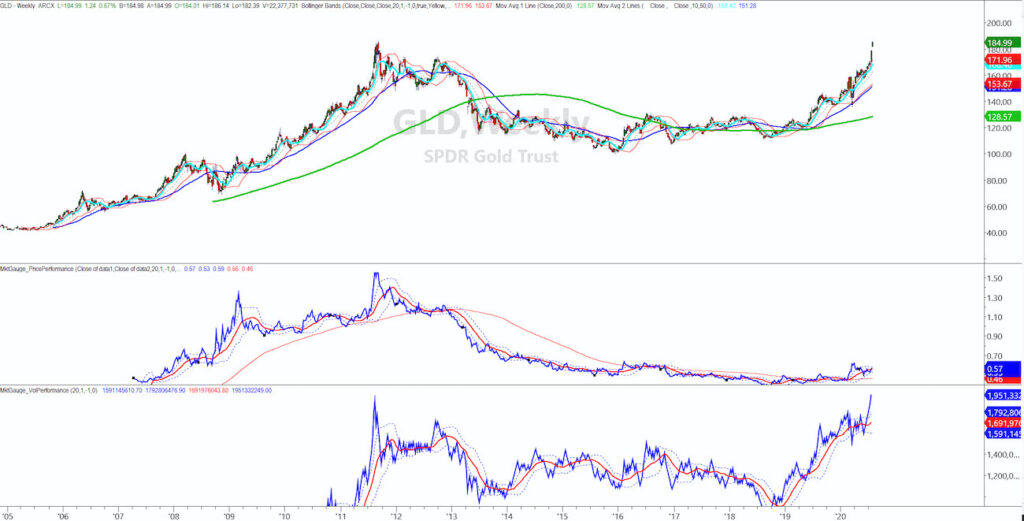
MarketGauge has some pretty cool proprietary software.
One indicator is Triple Play. That measures the ratio between a particular instrument and a benchmark.
Triple Play reveals the true trend strength of a market based on “price leadership” and “volume power”.
This measure of the market’s health gives you an advantage that other traders don’t have.
For example, many are calling for a top in gold.
Others have already taken profits and are out now in the position where they must chase to re-enter.
While others are using relative strength to reason that gold is overbought and must correct.
The Triple Play indicator shows us that gold will continue to trend.
Here’s why.
First, a word about Junk bonds.
The last daily I mention that JNK is a great way to time the market.
If JNK breaks the 200-WMA, then perhaps we can confidently say the move up is over.
However, as of today, JNK has moved up further thereby signaling no end in sight to risk appetite.
Regardless, gold has something else to say entirely.
Have a look at the middle box of the chart.
That shows the ratio between the S&P 500 and Gold.
In 2011, gold reached a price of $2000.
The ratio between SPY and GLD was at 1.57.
Today, with gold trading at or around $2000, that same ratio is at .57.
One-third of where it was in 2011.
What could that mean?
It could mean that gold is still well-undervalued relative to SPY and the ratio can double or triple from here before we hit 2011 levels.
Think about that top pickers!
Hot off the press-recent interview
Yahoo Finance 07-29-20 https://finance.yahoo.com/video/markets-higher-ahead-big-tech-143947402.html
Trader Rundown 07-28-20 https://www.youtube.com/watch?v=e2yNh1czGLU
S&P 500 (SPY) 323 now pivotal support if good
Russell 2000 (IWM) Cleared the 200-WMA and now has 150 resistance
Dow (DIA) 270 now resistance 262.50 support
Nasdaq (QQQ) 262 resistance with support at 250
KRE (Regional Banks) Unconfirmed recuperation phase. 38.31 must hold to confirm
SMH (Semiconductors) 165-168 resistance 160 support
IYT (Transportation) Back to an unconfirmed accumulation phase-. 172.55 must hold
IBB (Biotechnology) 142 resistance 136 support
XRT (Retail) New 2020 highs today
Volatility Index (VXX) Not a new low but maybe a double bottom-27.75 major support along with an inside day
Junk Bonds (JNK) Risk appetite on
LQD (iShs iBoxx High yield Bonds) 137.50 support
Twitter: @marketminute
The author may have a position in the mentioned securities at the time of publication. Any opinions expressed herein are solely those of the author, and do not in any way represent the views or opinions of any other person or entity.


