Crude oil futures are volatile enough on a normal day, but with rumors of a Russia/OPEC February meeting to discuss production cuts, it’s really volatile now.
As far as I can tell, the meeting and/or production cuts are currently an unfounded rumor – so we’ll wait to see if there is actual confirmation of this buzz. Nonetheless, the crude oil rally has continued into this week.
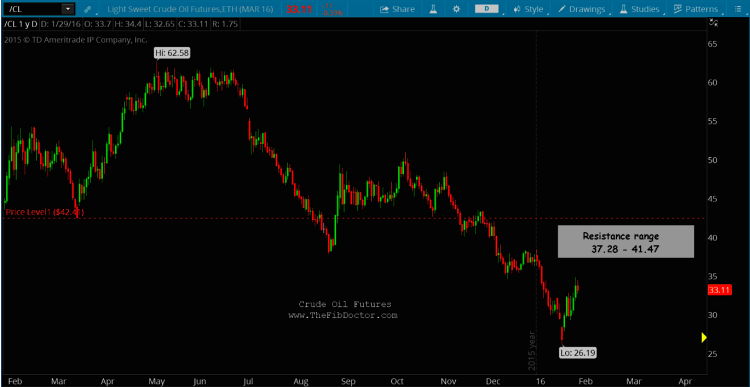
Note that buyers came in after a capitation-like move down to my long term target of $27.01 on January 20th, 2016.
If crude oil prices continue to push higher, the question is how high will this crude oil rally go ?
No one truly knows where the price of anything is going, but as a technician, I can share my calculated best guess with you. Those of you that are familiar with my style know that I normally give a price target and two levels of support or resistance. In this case, we’re looking for resistance.
I’ve identified four levels of resistance, all within a $4.19 range . I’ve highlighted that range on the chart below. If the crude oil rally reaches this price resistance zone, I’d expect a pullback there.
Crude Oil Futures – 1 Year, Daily Chart
Thanks for reading and remember to always use a stop.
Also from David Busick: Crude Oil Declines Into Major Fibonacci Price Target, Rallies
Twitter: @TheFibDoctor
No position in any of the mentioned securities at the time of publication. Any opinions expressed herein are solely those of the author, and do not in any way represent the views or opinions of any other person or entity.


