 Long time readers know that I believe the stock market’s direction is a function of the corporate credit market and the many derivatives that shape the latter. I laid out the thinking in this article – The New Era Of Trading Stocks Off The Credit Markets – and those articles linked from within the piece. If interested, I urge you to read them all because it will make the rest of this piece a lot less obscure.
With that as a backdrop, last week’s shelling of the stock market was not a great shocker. Below is a series of tweets going back to early August in which I warned that the credit market was no longer supporting the S&P 500 (SPX) at new highs. I am not posting them as a “victory lap”, but rather (1) to expose my thinking as I watch the movements in the credit markets – derivatives, spreads, and corporate issuance, and (2) as you will see in the last few tweets, to point out that without further damage in credit, stocks may be 2-4% away from finding the lows.
(The tweets were edited to make them more legible than when forced within 140 characters). See my Twitter stream for more.
Before open IG CDX was +1.5bps (≈ minus 15 $SPX pts). Last hour rally has been in face of IG CDX +2.5bps & near CRITICAL 75bps level $SPY (continued)
1:55 PM – 6 Aug 2015
Above IG CDX 75bps, it = open field for bears to scare the shit out of the bulls for multiple weeks/months. $SPX $SPY
1:57 PM – 6 Aug 2015
Despite the merciless beating in some groups, 3m $VIX curve remains a complacent +2.25. $SPX $SPY
2:40 PM – 6 Aug 2015
W/ IG CDX near 75bps, if the market bottoms around here w/out inverting 3m $VIX curve, it’d be… weird $SPX $SPY
2:45 PM – 6 Aug 2015
IG CDX now above 75bps $SPX $SPY – See yesterday’s tweets for more context
8:41 AM – 7 Aug 2015
Last time HY spreads were at these levels, $SPX was in midst of dropping 100pts (2075 -> 1975 oddly enough). A repeat is the better guess imho $SPY
4:29 PM – 12 Aug 2015
Very little from credit derivatives area to explain strong stocks reversal. IG CDX flat after pop above 77bps $SPX $SPY
1:42 PM – 17 Aug 2015
Checking in from road to c IG CDX at 78bps. Let’s be careful out there. $SPX $SPY
1:23 PM – 18 Aug 2015
IG CDX > 80bps while 3m $VIX curve still positive. My guess this drop ends w/ curve STEEPLY inverted which will make for a hell of an $SPX $SPY dump
10:59 AM – 19 Aug 2015
More likely scenario in my opinion: grinding deep correction (10-20%) where rallies get bot only to get puked lower until we get a really scary drop $SPX $SPY
8:01 PM – 19 Aug 2015
3m $VIX curve slightly inverted & IG CDX better than stocks by equivalent of 16 $SPX pts. Doubt we r seeing lows, but it’s a step in right direction $SPY
11:21 AM – 20 Aug 2015
As $ES_F lost 2050, IG CDX actually improved .3 bps. The magnitude is not that important but don’t ignore the positive divergence $SPX $SPY
12:51 PM – 20 Aug 2015
1/2 As I suggested yesterday, stocks are now catching down to credit; on the bright side IG CDX was ↓ “only” 1bp i.e. outperformed $SPX by 30pts. $SPY
4:04 PM – 20 Aug 2015
2/2 need to see IG CDX start recovering & day of big issuance as key tells that slide is ending. For now only have a solidly inverted 3m $VIX
4:07 PM – 20 Aug 2015
1/2 Eyeballing the move in the IG CDX from mid-July (65bps) to today (80bps) an equivalent $SPX move would have it at ≈ 1950. $SPY
9:16 AM – 21 Aug 2015
2/2 If/when $SPX gets there, how IG CDX, cred spreads, & most importantly issuance (post Labor Day surge) behave, should show the way $SPY
9:18 AM – 21 Aug 2015
I won’t belabor the path that got the S&P 500 to where it is now. I will instead focus on two things: first, I think it is useful to put the current credit market damage and subsequent drop in stocks in context relative to other post ’07-‘08 scary moments; and second I will look at near term targets for both equities and the credit markets.
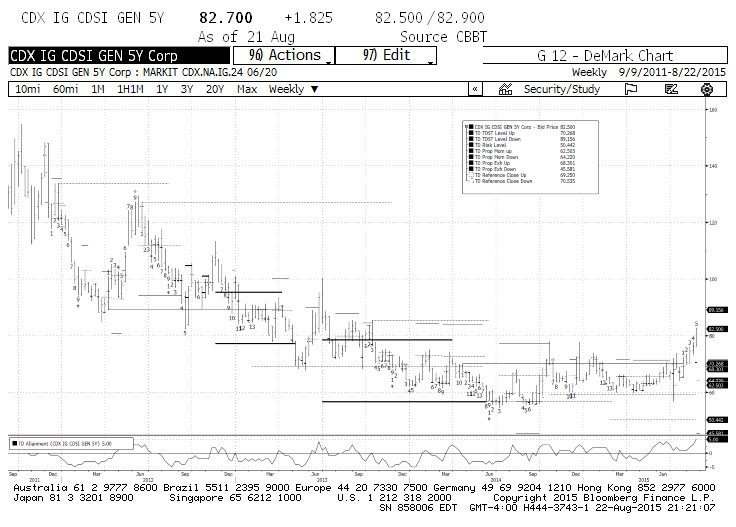
Starting with corporate credit market derivatives, which is what bearish speculators flock to first (they tend to be the least expensive and most leveraged derivatives at the beginning of a correction), the following chart shows that the IG CDX has just now crossed into the area where a meaningful correction or cyclical bear market for equities is a possibility (it’s tough to see on the .jpeg, but the threshold is at 80bps).
This is reinforced by the widening in High Yield corporate spreads. Overlaying DeMark indicators on the Barclays US Corporate High Yield (HY) Index (below), two items stick out: i) for the first time since the 2011 bear move, the weekly chart has completed a TD Sell Setup, and ii) the price (spread level) has crossed above the active TDST Level Up. Taken together, these indicators argue that there has been a change of character not seen since the 2011 bear market. If the break of the TDST Level Up line were to be “qualified”, it would underscore that the current market correction may have legs for several weeks.
Tempering the pessimism (and on my tweeter stream the loudness of credit bears calling for Armageddon is utterly deafening already), are the absolute levels of High Yield spreads: with no need to go back to the ’07-’08 crisis, High Yield spreads reached 820bps during the 2011 “debt ceiling” crisis, and 690bps in June 2012. They closed at 560bps on Friday.
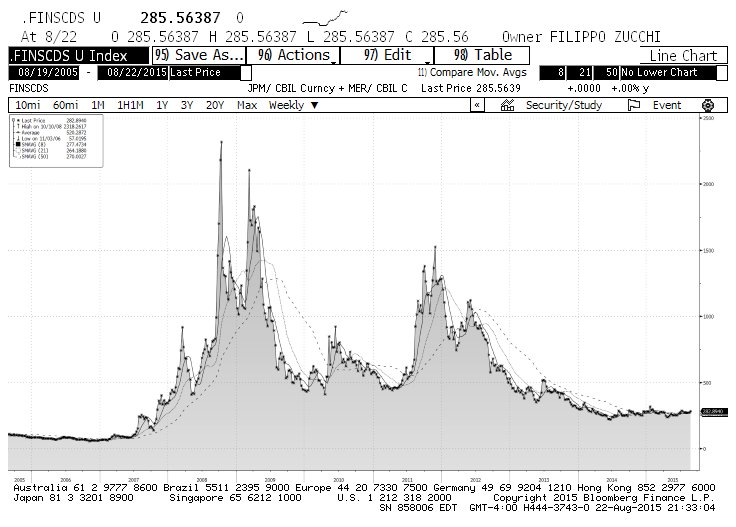
More importantly, my home-grown index of CDS on debt of large U.S. financial institutions sits at 282bps, nowhere even close to the year highs, let alone the 2011 highs of 1525bps or the 2012 highs of 1120bps. In other words, there’s absolutely no stress or even worries in the credit of the institutions that are most likely to suffer from a systemic crisis if one were around the corner.
Put all these “tells” together, and my sense is that the current weakness is severe, but probably nothing more than a long overdue bout of equity buyers’ exhaustion, and credit bear-rattling. If the strength of the stock market over the last six years has reduced participants to believe that every 10%, 15%, or even 20% market correction, or even a deeper cyclical bear market can only happen in the context of a financial meltdown, those participants need to re-adjust their investing compasses.
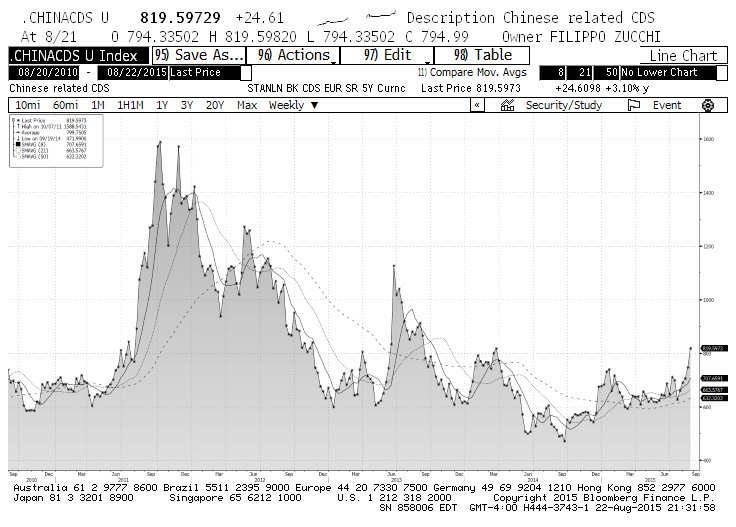
Before turning to the subject of nearer term targets for stocks, two caveats to my longer term optimism. One, I have consistently stated that China is the potential “black swan”. Its experiment in government manufactured capitalism and its insane misallocation of capital will eventually come home to roost. But given the amount of money it has available to plug holes, and the dictatorial determination of its rulers not to let things get out of hand, I think a China implosion is several years out. Nonetheless, I’d offer that watching carefully the CDS of financial institutions tied-to-the-hip of China’s finances is absolutely essential to gauge the overall level of systemic risk. My index of such CDS is currently agitating to a degree similar to the IG CDX. Not good but nowhere close to systemically dangerous.
Two, the direction of the US stock market will continue to depend on the ability of companies to buy back their stocks through cash flow and, more importantly, the issuance of corporate bonds. Should the bond market start refusing to fund buybacks, the prospects for stocks will turn more ominous. Post Labor Day is one of the handful of periods during which corporate bond offerings surge. Should corporate debt buyers pull in their horns (it happened for the January surge this year, but it was made up in February and March), equity risk would increase significantly.
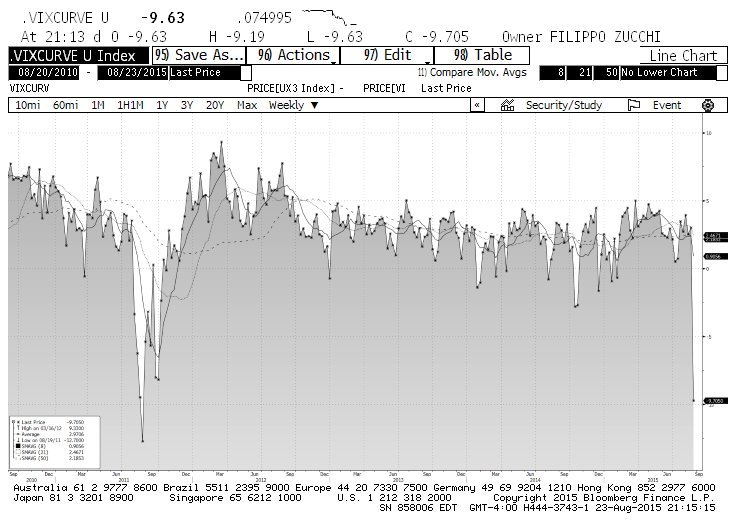
And now to what concerns our daily P&L. You may have noticed that some of my tweets on Thursday and Friday pointed out some positive divergences between credit and equities. In other words, just as credit deteriorated far more than stocks through last Monday, so did stocks underperform credit on Thursday and Friday. Net-net, my sense is that with the SPX around 1950 and the IG CDX about 82bps, the two are now in equilibrium. The wild inversion of the 3-month Volatility Index curve (VIX) also suggests that equity traders are experiencing a come-to-Jesus-fear moment.
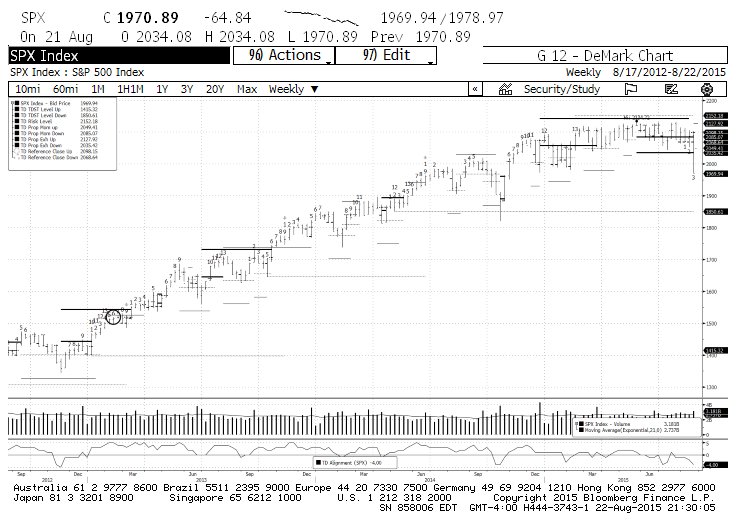
I am considering daily DeMark Relative Retracement levels at 1930 and1900 as “margin of error slippage” for stocks given the aggressiveness of the recent selling. (i.e. it would not surprise me one bit if stocks dropped to those areas without further credit deterioration).
A more important stock level is the weekly TDST Level Up at 1850. Holding 1850 preserves the weekly upward trend for stocks, something necessary to avoid a change of character to “cyclically bearish”. In my view a drop to 1850 would require more credit weakness, so any stabilization in the latter will make another 100 points drop much less likely.
In conclusion, this nasty pullback should not have come as a surprise to corporate credit watchers. It’s been pretty vicious, but then again, the sharpest moves tend to be of a countertrend nature (remember October 1987?). Whether the credit market finds its legs before drawing stocks closer to the 20% correction threshold remains to be seen, but, from a secular standpoint, everything I watch points to new stock highs when the current shake-out is over.
Thanks for reading and good luck out there.
Twitter: @FZucchi
The author has a position in S&P 500 Index (SPX) related securities. Any opinions expressed herein are solely those of the author, and do not in any way represent the views or opinions of any other person or entity.

