Many, in fact most retail investors that were surveyed, believe that the bonds have bottomed.
Bill Ackman came out last week extremely bearish.
Here’s the technical skinny.
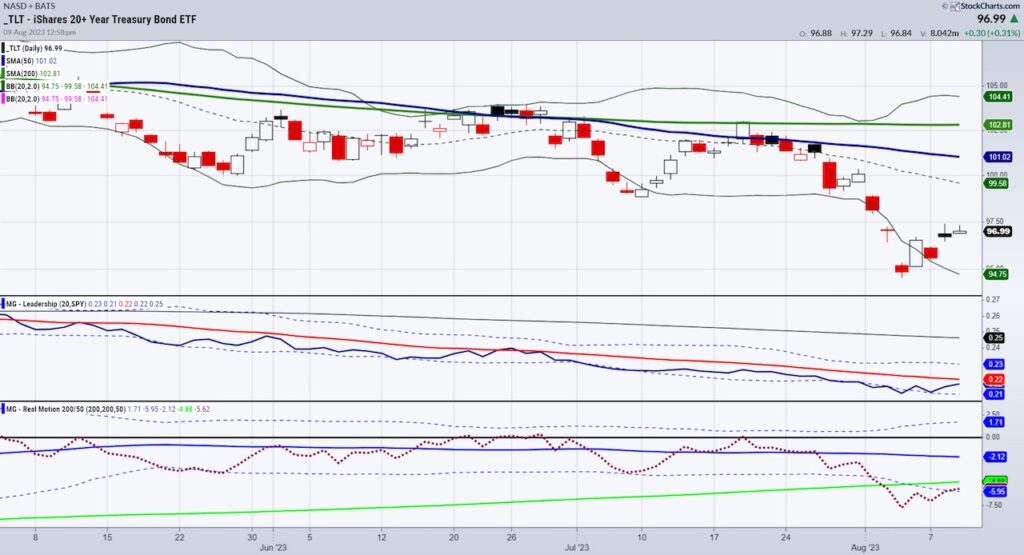
Last week, TLT had a classic reversal bottom on very oversold conditions.
Although TLT still underperforms SPY (risk on) according to the Leadership indicator, TLT did gain traction.
On the Real Motion indicator, TLT is having a mean reversion meaning, that the red dots are crossing back over the Bollinger Band.
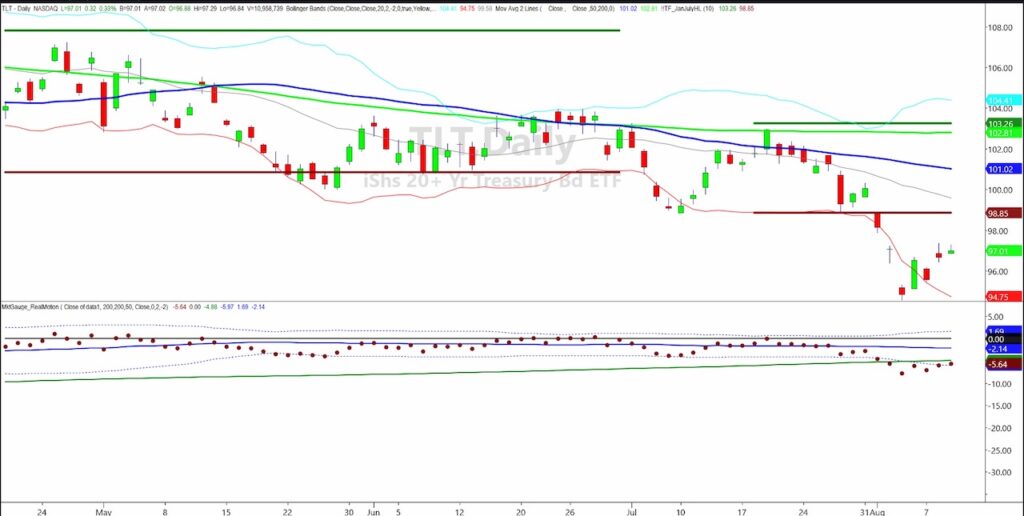
Price has come back from the lows true. However, the gap that was left on August 2nd has yet to be filled.
97.90 fills that gap and thus far on this move, TLT has risen to 97.37.
Perhaps the most interesting is that since the gap lower, TLT has failed to clear 97.24-97.37.
Is that then, a triple top or just a point of resistance which will at some point, clear?
On the weekly chart (not shown), TLT is having an inside week meaning the trading range thus far is still inside the range of last week.

Finally, as we have been examining the July 6-month calendar ranges, TLT is far below the July calendar range low.
During the January range, TLT never cleared the January calendar range high.
Furthermore, TLT never really broke below the January calendar range low.
That is quite a different story from the present.
Many fundamental analysts believe that when/if bonds rally, especially if they start to outperform the SPY, a recession is nigh.
Others believe that the FED will stay higher for longer and yields may flatten, and possibly go higher, not lower.
Regardless, to think bottom we need to see the momentum improve, the gap filled, and SPY fall further from here.
Otherwise, this is a technical bounce after a splendid sell-off and nothing more.
Twitter: @marketminute
The author may have a position in mentioned securities at the time of publication. Any opinions expressed herein are solely those of the author and do not represent the views or opinions of any other person or entity.


