The Semiconductor Sector ETF (NASDAQ:SMH) is a huge piece of the
what-happens-next puzzle for tech stocks and perhaps the broader stock market.
Those who know me know that I have talked a lot about the end of the bullish cycle in tech and many tech stocks since July 2024.
I rarely recommend buying most things tech this year unless one is an active investor.
Yet, that viewpoint remains highly unpopular.
That is fine, I am open minded.
With that, the charts are key, of course. So let’s look at the monthly. weekly, and daily charts of the Semiconductors Sector (SMH).
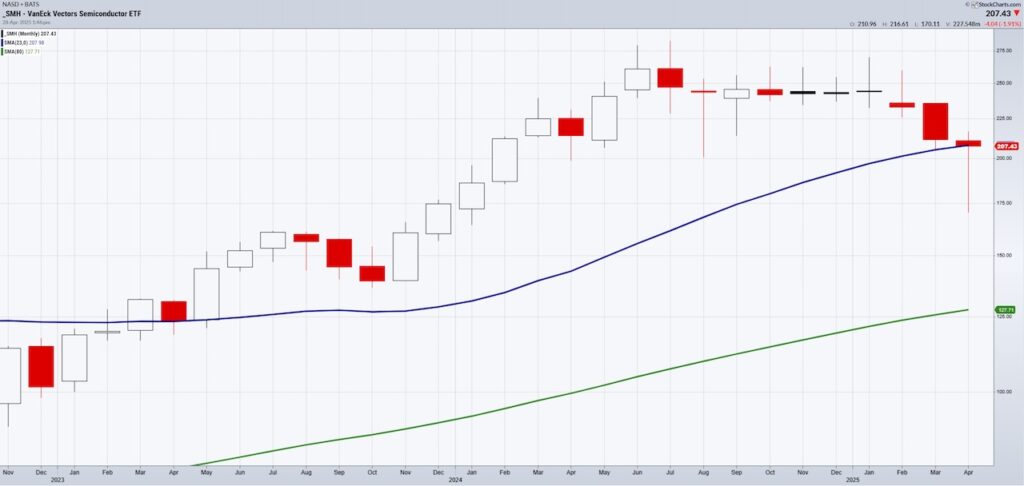
Starting with the monthly chart, we get a broad picture.
Yes, while the other members of the Economic Modern Family trade below the 23-month moving average (blue), our semiconductor ETF (SMH) sits right on it. SMH is outperforming.
Nonetheless, with April ending on Wednesday, the price bar closes will be pivotal.
208 is where the 23-month Moving Average (MA) intersects. The slope is up, which is a relief. However, a close on Wednesday beneath that would give us pause.
The last time SMH broke beneath the 23-month was in April 2022. It took a year for the sector to recover back over that moving average.
We like the 23-month MA because it represents a 2-year business cycle.
Should SMH hold 208, we next look at the weekly timeframe chart.
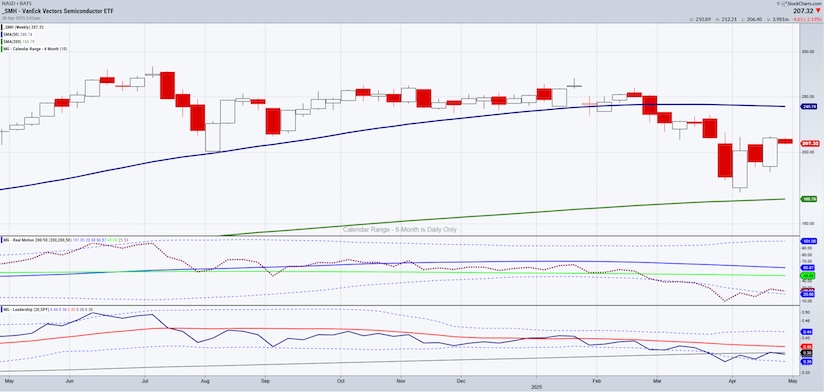
We use a 50 and 200-Week Moving Average (WMA) on the weekly timeframe.
SMH underperforms the benchmark (Leadership)
Real Motion shows a bearish divergence as the red dots are beneath the 50 and 200 WMAs, while the price chart shows the price below the 50-WMA but above the 200-DMA.
The April 9th low is 170.11, which would be a fair target if the sector weakens further while 230 would be a reasonable target if the sector holds.
On the Daily chart…
This week there will be lots of earnings.
Many are in the tech sector.
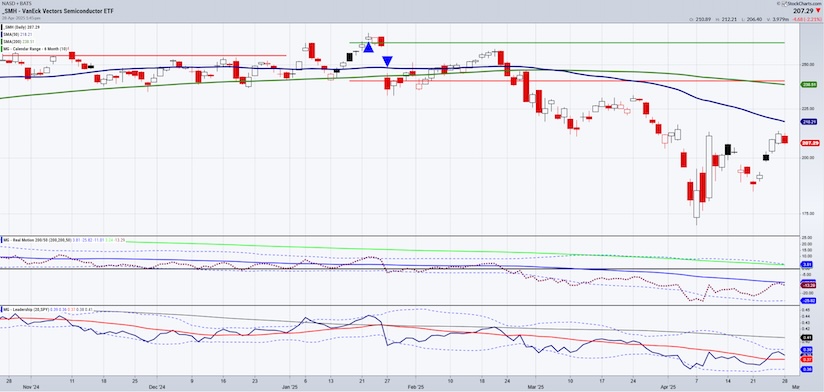
SMH outperforms the benchmark on the Daily timeframe.
Real Motion shows no real divergence between price and momentum.
The 50-DMA shows a declining slope and the phase is bearish.
Basically, the monthly says watch 208 for info on a 2-year business cycle expansion or contraction.
The weekly says watch 215 then 240 on the upside. Watch 200, 185 and 170 on the downside.
And the Daily says with good earnings we could hit the 50-DMA at 218 but watch momentum to play along.
We err more to a bounce to resistance and then another sell-off.
We shall see soon enough.
Twitter: @marketminute
The author may have a position in mentioned securities at the time of publication. Any opinions expressed herein are solely those of the author and do not represent the views or opinions of any other person or entity.


