I regularly screen for stocks making new highs and new lows, usually on a three-month time frame. The logic here being that if a stock is making a new three-month high, it’s either in an established up-trend or it’s just beginning a rotation to a bullish phase.
On the other hand, stocks making new three-month lows are either in established downtrends (of which there honestly aren’t many these days) or they are beginning to rotate from a bullish phase to a bearish phase.
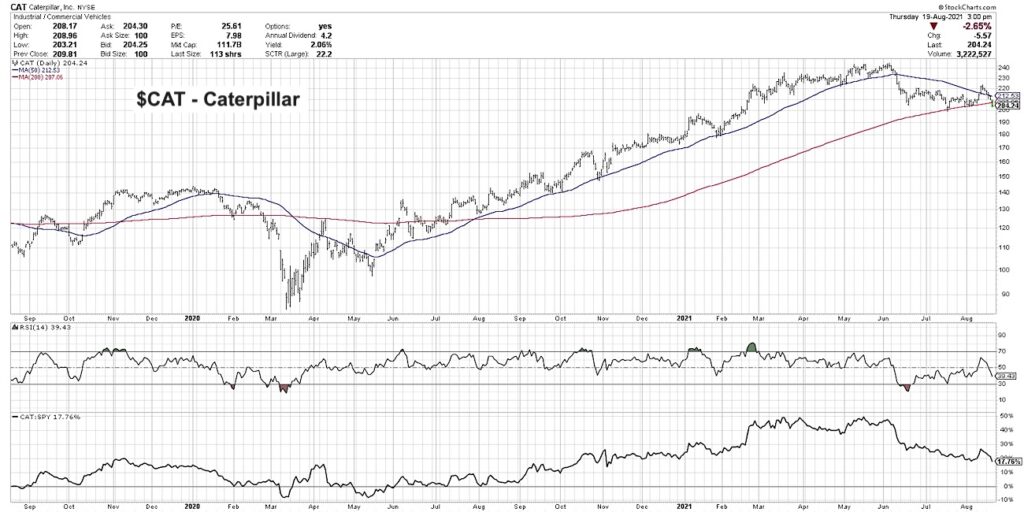
I noticed a number of stocks that were not only on the three-month low list but also were testing a key support level: the 200-day moving average. I’ve often referred to the 200-day as the “long-term barometer” for a stock price. In general, it’s a good approach as a trend-follower to own stocks that are above their 200-day moving average.
Three stocks in particular are testing their 200-day moving average this week. While these stocks- Tesla (TSLA), Disney (DIS) and Caterpillar (CAT)- represent three different sectors and three very different business models, they are similar in that they are attempting to remain above this important smoothing mechanism.
In today’s video, we’ll discuss each of these stocks along with a semiconductor name in a very similar technical configuration. We’ll show other stocks that have already broken down through their own 200-day as a preview of what may be next for these charts. Finally, we’ll present a breadth indicator based on the 200-day moving average that may be indicating further weakness ahead.
– What should we expect as TSLA, DIS and CAT test their 200-day moving averages?
– What would a breakdown tell us about investor expectations for these widely-followed mega cap stocks?
– What percent of S&P 500 members are above their 200-day moving averages, and what does this tell us about overall market conditions?
One Chart [VIDEO]: $TSLA $DIS $CAT
$CAT Caterpillar Stock Chart with Moving averages

Twitter: @DKellerCMT
The author may have positions in mentioned securities at the time of publication. Any opinions expressed herein are solely those of the author, and do not in any way represent the views or opinions of any other person or entity.


