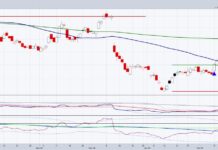
How might a major top for the S&P 500 stock market index play out in July and August? We try to answer this question today.
While we can’t predict the future, we can certainly benefit from the fact that major stock market tops have occurred many times in market history, and they often display very similar characteristics.
Domino’s Pizza Group (GPZ) could provide a perfect case study of the transition from accumulation to distribution, with distinct signals like an inability to make new highs, price breaking below moving averages, and sudden deterioration in price momentum.
By understanding these characteristics in DPZ, potential parallels in the broader S&P 500 can also be explored, especially as we head into the often tumultuous months of August and September.
In today’s stock market video, we delve into the specifics of DPZ’s recent performance, interpreting single-day gaps, and the subsequent response from investors. Through examining DPZ’s price movements, we’ll illustrate how similar trends might foreshadow broader market behavior, stressing the importance of vigilance and prepared strategy. I want to emphasize how technical factors such as Dow Theory, moving averages, and RSI can signal the end of an uptrend!
- What signals mark the transition from an accumulation phase to a distribution phase?
- How can moving averages and RSI trends help identify a stock entering a distribution phase?
- What should we monitor on the S&P 500 chart to spot potential signs of a stock market top?
Video: What to look for in major stock market tops
Twitter: @DKellerCMT
The author may have positions in mentioned securities at the time of publication. Any opinions expressed herein are solely those of the author, and do not in any way represent the views or opinions of any other person or entity.


