Stocks have remained elevated longer than investors imagination this year.
A Crash, a pandemic, political disarray… no problem.
Several U.S. stock market indices and sectors are trading at new all-time highs. Another lesson in why active investors and traders should tune out the noise and follow the price action.
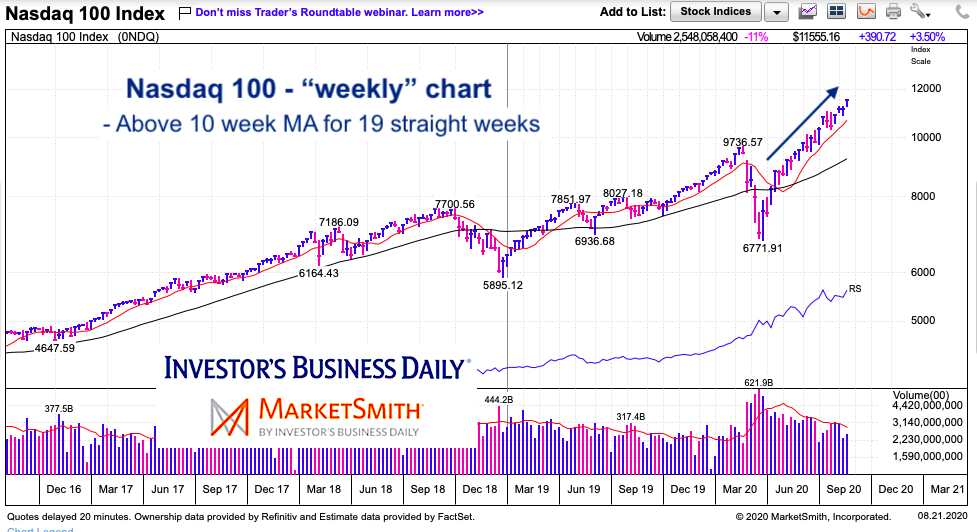
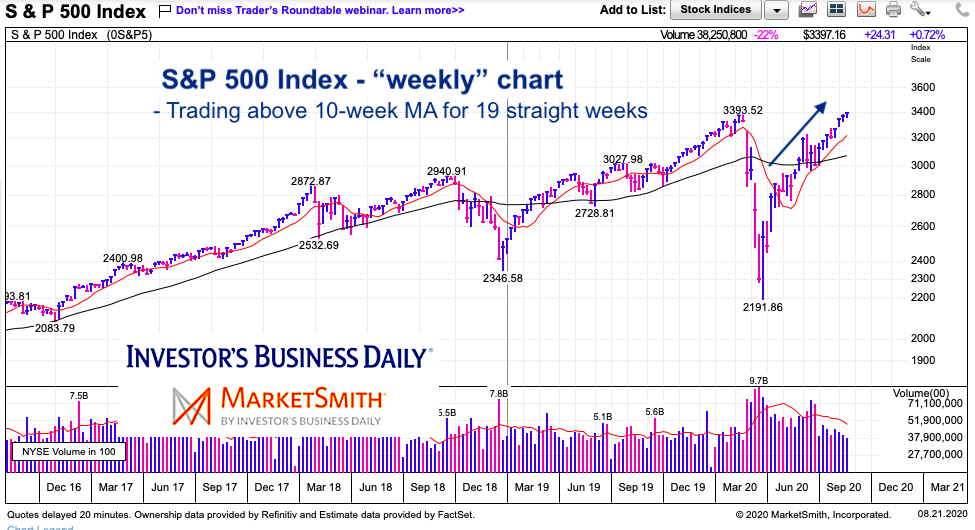
Today, we simply share two charts that highlight the strong intermediate term trends for the past 4 months on the Nasdaq 100 and S&P 500 Indices.
Note that the following MarketSmith charts are built with Investors Business Daily’s product suite.
I am an Investors Business Daily (IBD) partner and promote the use of their products. The entire platform offers a good mix of technical and fundamental data and education.
Nasdaq 100 Index “weekly” Chart
For 19 straight weeks the Nasdaq 100 has traded above its 10-week moving average (a trend indicator). Note as well that this large cap tech index has traded at new highs for nearly 3 months.

S&P 500 Index “weekly” Chart
Ditto here on this trend indicator. The S&P 500 Index looks poised to trade above 3400 this month. This is a bit of hindsight, as both indexes are likely overdue for a “real” correction… 19 straight weeks is a long time. That said, we will need to see price break below a key MA to signal longer-term caution.

Twitter: @andrewnyquist
The author may have a position in mentioned securities at the time of publication. Any opinions expressed herein are solely those of the author, and do not in any way represent the views or opinions of any other person or entity.


