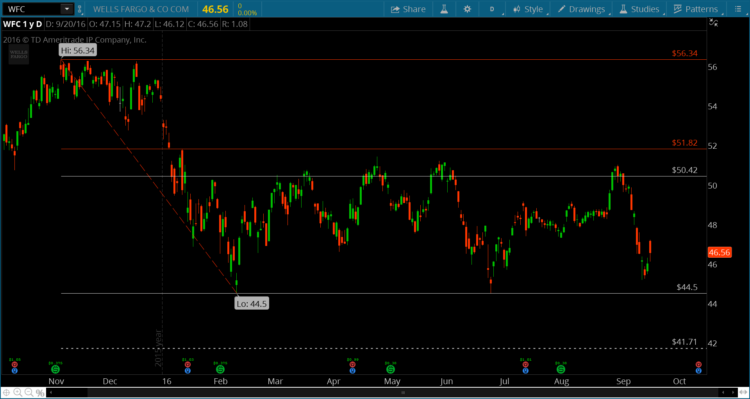
Wells Fargo’s stock price (NYSE:WFC) has spent much of 2016 trading between $44 and $51 per share. But that range could get broken to the downside when looking at the stock chart and using fibonacci analysis.
Looking at the chart below, we can see that each of the past three times that Wells Fargo stock (WFC) rallied up near $51 it was rejected. And the latest rejection came just days before news broke that the bank was being fined for a scandal involving the opening of fraudulent customer accounts.
The latest decline in shares of WFC should test the lower end of the range at $44. And assuming that breaks down, the target becomes $41.71.
The stock may find support at that fibonacci price level, however it would be wise to stay disciplined if involved with the stock (i.e. stops).
Wells Fargo Stock Chart (WFC) – Daily
Thanks for reading. Note that you can get more of my trading insights and Fibonacci analysis at Bottom Line Trades.
Twitter: @TheFibDoctor
No position in any of the mentioned securities at the time of publication. Any opinions expressed herein are solely those of the author, and do not in any way represent the views or opinions of any other person or entity.


