Broker/Dealer Index
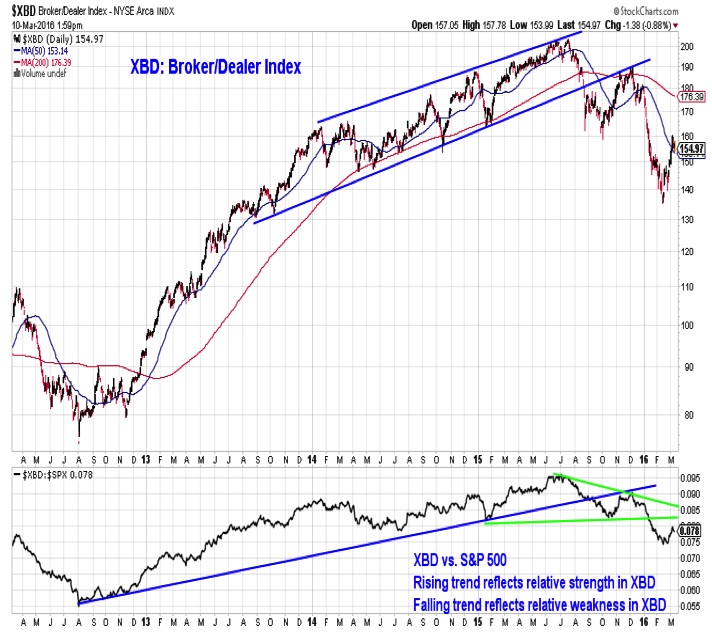
While the S&P 500 has gotten out ahead of its 50-day average and has moved toward its 200-day average, the Broker/Dealer index has struggled just to hold its 50-day average. The Broker/Dealer index was a relative leader stretching back to 2012, but since the middle of last year has made lower highs and lower lows on a relative and absolute basis.
Biotechnology Index
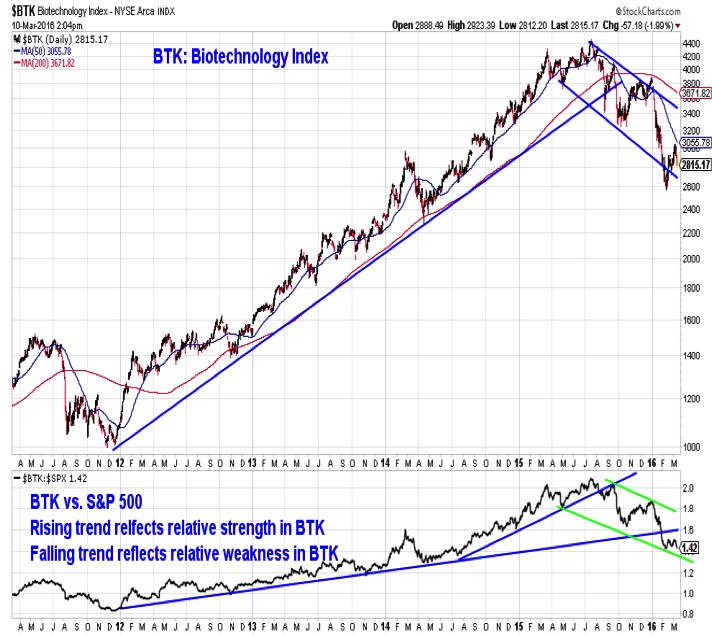
Relative leadership from the Biotech index stretches back to 2011, but this trend is also being challenged. The Biotech index was not even able to get above its 50-day average on the recent rally. While the absolute price trend was broken last year (and a series of lower highs and lower lows has followed), it has been the relative weakness in biotech so far in 2016 that has pushed it below its relative price trend line.
Utilities Sector
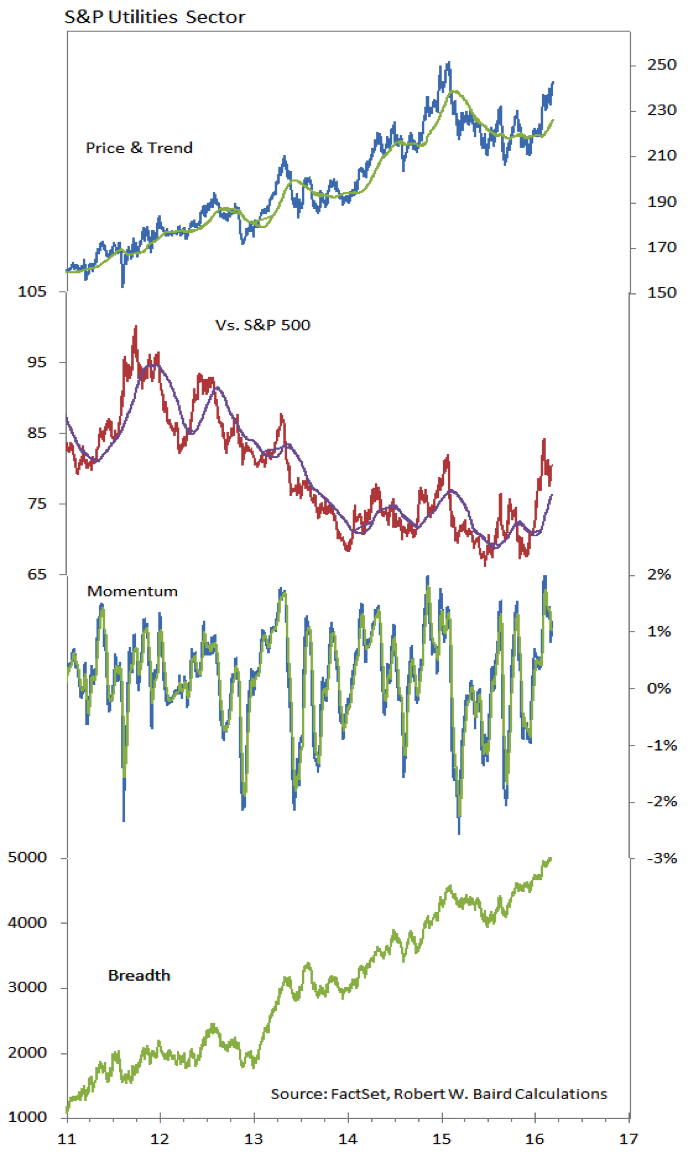
In contast to what we are seeing from Broker/Dealers and Biotech, Utilities have seen improving relative strength, fueled by absolute price gains, strong momentum and sector-level breadth that remains robust.
Thanks for reading this week’s stock market outlook. Have a great weekend.
Twitter: @WillieDelwiche
Any opinions expressed herein are solely those of the author, and do not in any way represent the views or opinions of any other person or entity.


