$TRIN & $TICK:
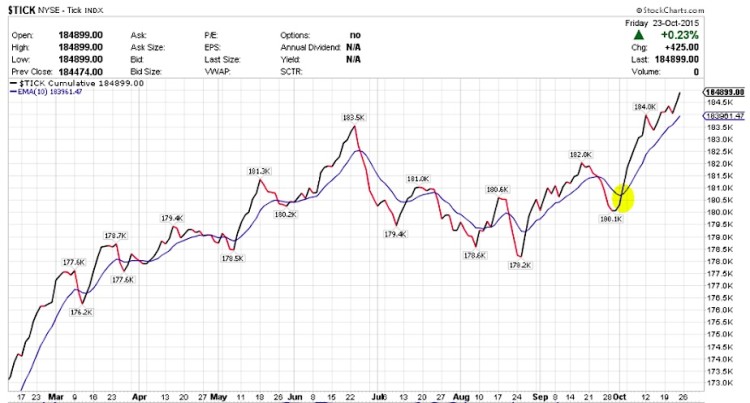
The TICK stock market indicator was extended earlier on from the 10 EMA and started catching up with it.
Now after the last few days with a multitude of positive TICK, it’s running higher. I would look for a small pause again this upcoming week.
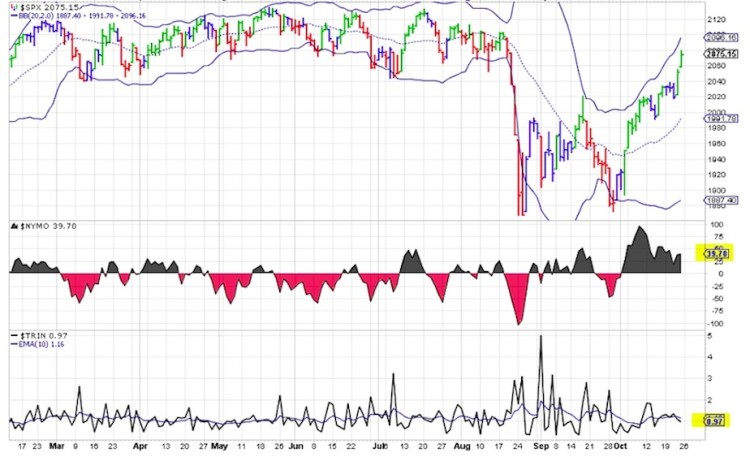
The TRIN stock market indicator has been over 1.00 for 10 out of 11 trading sessions. Friday it finished at 0.97, pretty close. TRIN has been a great indicator over the last 3-4 weeks where it provided a lot of clues that the rally had legs to run.
I’ll be monitoring both TICK and TRIN very closely to see where stocks may be headed next.
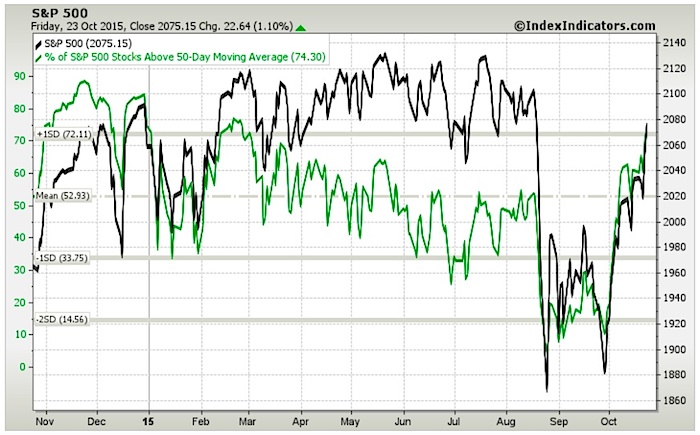
% of S&P Stocks Above 50-Day Moving Average – 74.30. Was 60.56 last week.
$SPXADX – Advance-Decline Data:
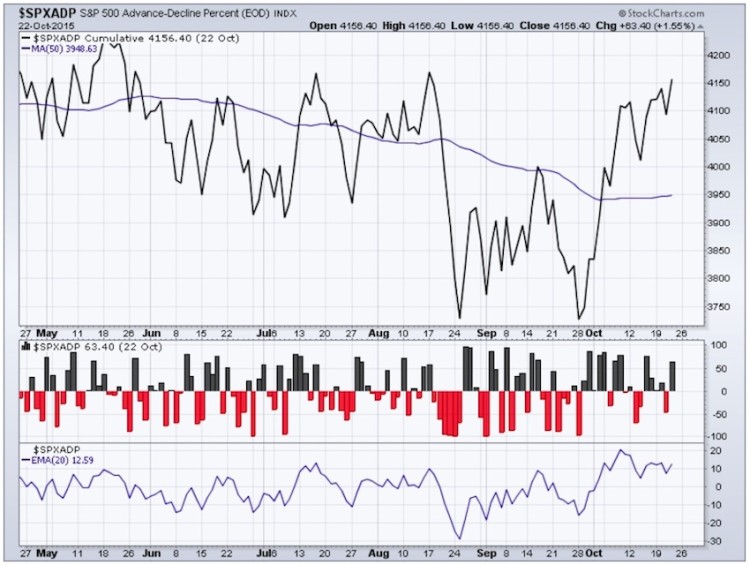
The Triple view of the Advance Decline data for the S&P 500 (SPX). After some consolidation mid week, the Advance-Decline Line has started to move higher. Remember, last week I had mentioned that the 50 day moving average was flat and it will be bullish if it starts to rise. Well, this week it has started to turn up.
$VIX:$VXV:
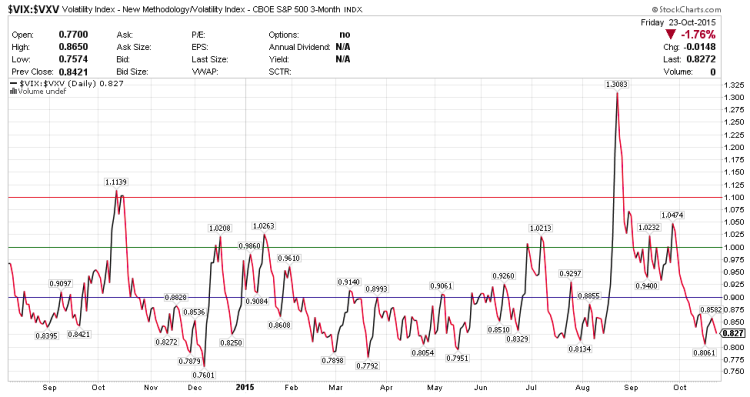
VXV is the 3 month volatility index. The relationship between VXV and VIX (30 day volatility) or the ratio between them if > 1.00 often spells trouble for equities. This ratio started to move higher earlier on the week to 0.8582 and ended the week back towards the lows at 0.827. Expecting this to remain subdued with mini pops along the way.
S&P 500 ETF (SPY) DAILY TIMEFRAME:
On a Daily timeframe, SPY started last week on a sideways trajectory. However, on Tuesday of last week, SPY printed an Evening Star. As always, these DOJI type candlesticks require confirmation up or down the next day on this timeframe. The evening star was confirmed lower on Wednesday with more or less a bearish engulfing candle. Price closed right below the recent breakout zone of 201.75-202. However by after hours close, price was back inside this range. Here is where many failed to noticed the strength behind the scenes (i.e. buying pressure). Overnight futures reversed back to green. On Thursday, price action caught many snoozing and reversed the move higher finishing very strongly above 204.40 (which was a resistance). Many thought the rally would fail there. On Friday, we saw a gap higher and finished the week very strongly. However the daily candle that printed on Friday looks like a Hanging Man and if confirmed, prices may move lower short-term.
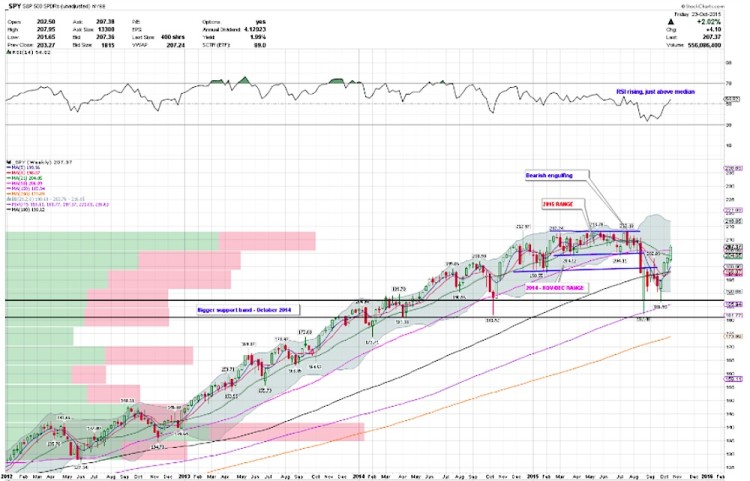
As far as momentum indicators go, the Relative Strength Index (RSI) is rising over its median and this is bullish. It is over 60 and nearing 70. MACD continues to rise but is a tad extended.
With respect to price, it is extended from its moving averages. A short-term pullback to retest the 200 day moving average or even 205ish would be very bullish if it holds. SPY closed over the 200 and 50 day moving averages. Note that the 200 day moving average has started to turn back up.
Thanks for reading and have a great week. You can read more of my weekly analysis on my website. Thanks for reading.
Twitter: @sssvenky
The author has a net long position in S&P 500 related securities. Any opinions expressed herein are solely those of the author, and do not in any way represent the views or opinions of any other person or entity.

