Market Breadth
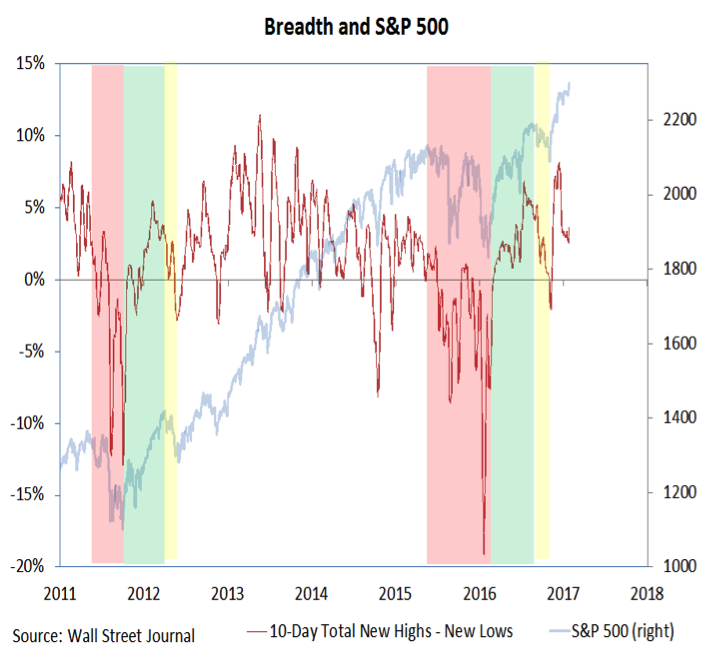
This week’s rally has been accompanied by an expansion in the number of issues making new highs. The up-tick has been modest on a 10-day basis, but daily new high data has been more supportive. Yesterday (January 25), for example, saw the most issues on both the NYSE and NASDAQ making new highs since December 9.
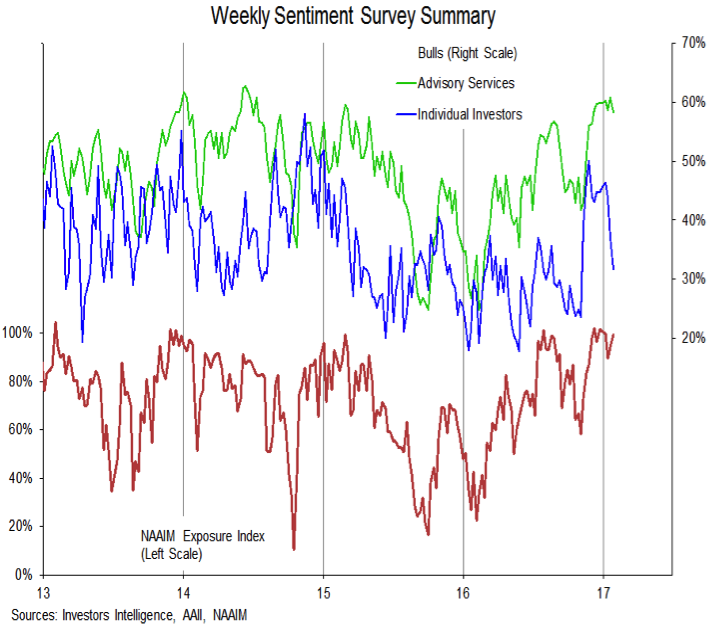
We put our three primary weekly sentiment survey indicators on one chart to try to show how sharply individual investor sentiment is diverging from the other measures. AAII bulls this week dropped to just 32%, the lowest level (and first time with fewer bulls than bears) since the first week of November. Advisory service optimism ticked lower last week, but it is just below a multi-year high. The NAAIM Exposure index is just a few points off its high. While optimism still looks excessive from our vantage point, it is clearly not universal. It is also important to remember that optimism can remain elevated for extended periods of time (whereas pessimism tends to spike and quickly dissipate).
Copper
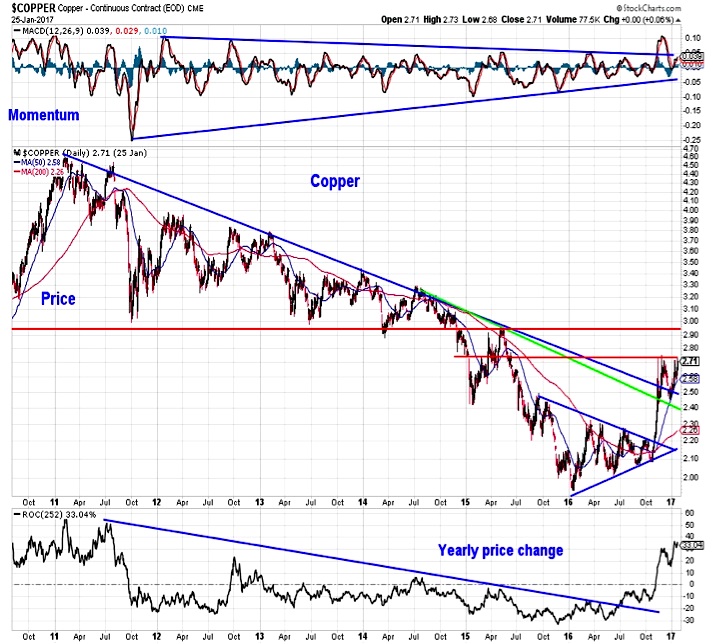
Copper remains in a post-breakout consolidation from a price perspective, but the yearly change continues to move higher. This has broken a multi-year downtrend and as discussed in our Macro Update could have positive implications for both S&P earnings and overall economic growth. A break above 2.70 would suggest the consolidation has run its course and could set-up a test of the early 2015 peak near 2.95.
S&P Materials Sector
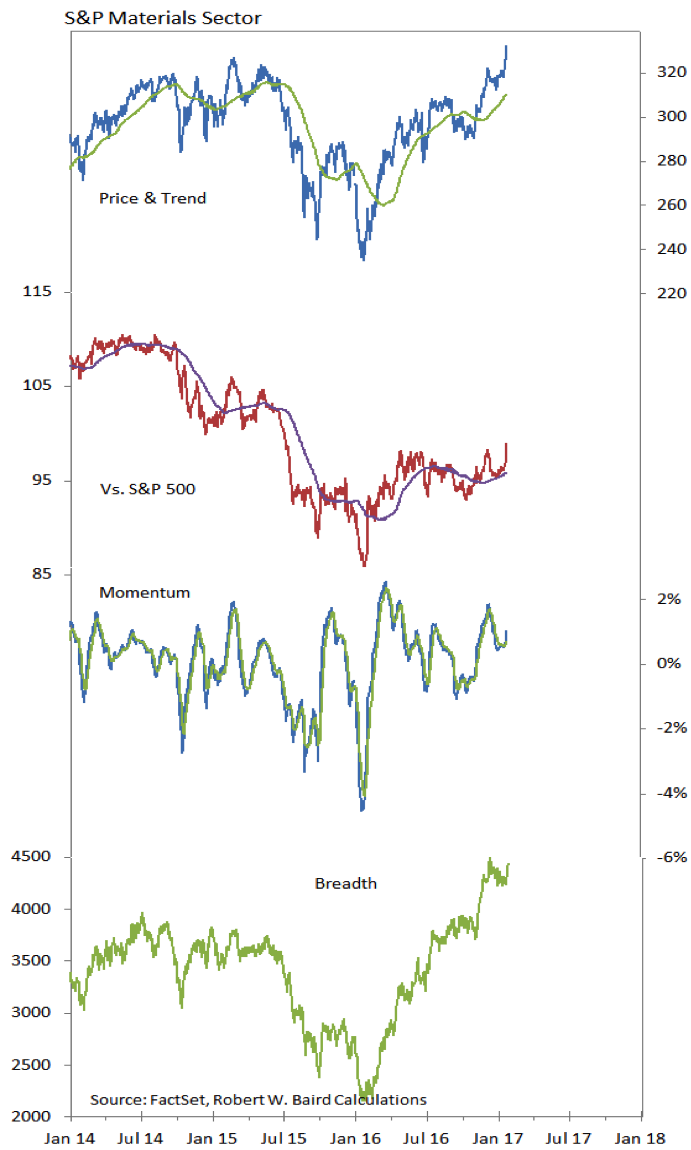
Echoing the strength seen in commodities, the Materials sector has gotten off to a strong start in 2017 (and it is the best performing sector so far this year). It has broken out to new highs on both an absolute and relative basis, supported by a strong breadth tailwind and improving momentum trend.
Thanks for reading.
Twitter: @WillieDelwiche
Any opinions expressed herein are solely those of the author, and do not in any way represent the views or opinions of any other person or entity.


