Market Breadth
The daily advance/decline line seems to be holding up a little better in recent trading sessions and the McClellan Oscillator (a short-term breadth indicator) has moved above its December high.
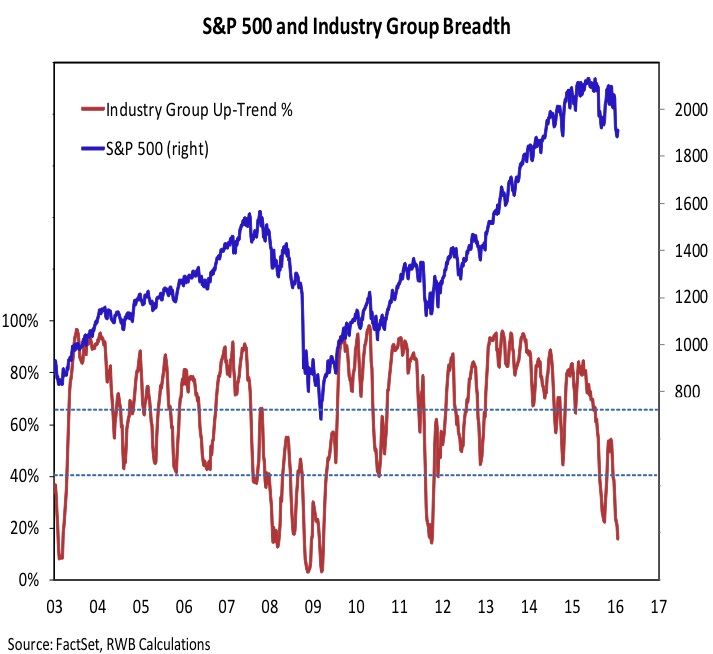
Improving market breadth now is important if there is going to be a chance of a positive breadth divergence on any re-test of the January stock market lows. A textbook pattern would be for price to undercut its previous low with breadth making a higher low. Based on our industry group trend indicator, there is not yet evidence of an initial low being in place from a market breadth perspective and this weighs on the overall stock market outlook.
Improved near-term breadth would be a step in the right direction.
Global Equities View
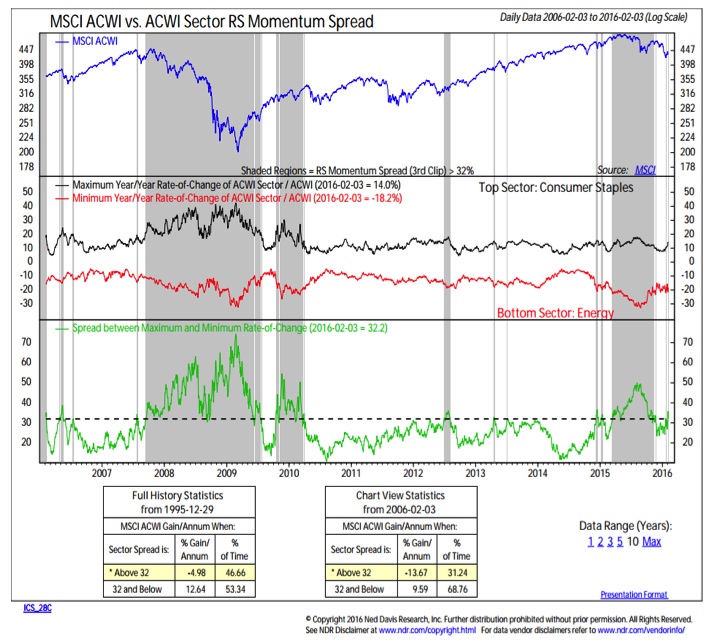
Another way to look at breadth is the spread in year-over-year returns between the top sector and bottom sector. A narrow spread has been consistent with stock market strength, while a wide spread, as we had for much of 2015, is consistent with overall weakness. The move off of the lows by Energy (and Materials) helps narrow this spread and could also be sowing the seeds for a better market breadth backdrop later this year.
S&P Materials Sector
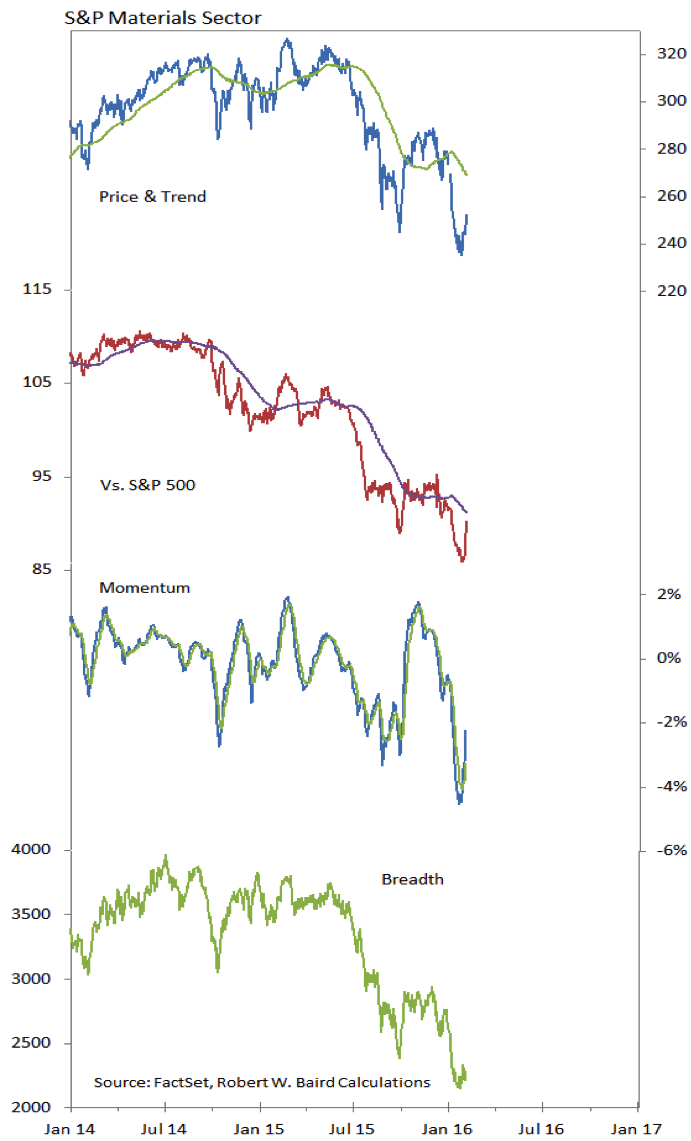
Weakness in the dollar appears to be helping fuel a bounce in the Materials sector. The daily charts here show that on both an absolute and relative price basis Materials have caught a bid. Whether this is just an oversold bounce remains to be seen, but momentum has turned higher and market breadth, too, is off of its lows. The weekly chart shows an even more constructive picture – the sector is at a 4-week high and there is a positive divergence between momentum and price.
Thanks for reading.
Twitter: @WillieDelwiche
Any opinions expressed herein are solely those of the author, and do not in any way represent the views or opinions of any other person or entity.


