Market Breadth
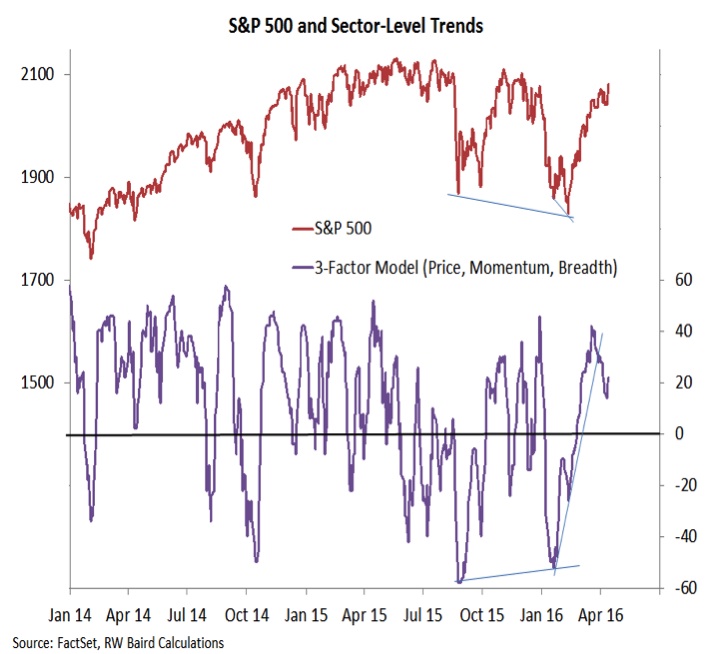
I don’t usually like to share the same exact chart two weeks in a row, but this is an exception. Last week I pointed out the deterioration in our sector-level trend indicator, which had done a good job of leading the price rally off of the 2016 lows. Over the last two days, this indicator has gotten back in gear and is again rising. Improving sector-level trends are a bullish tailwind for the S&P 500.
Sentiment / Speculation
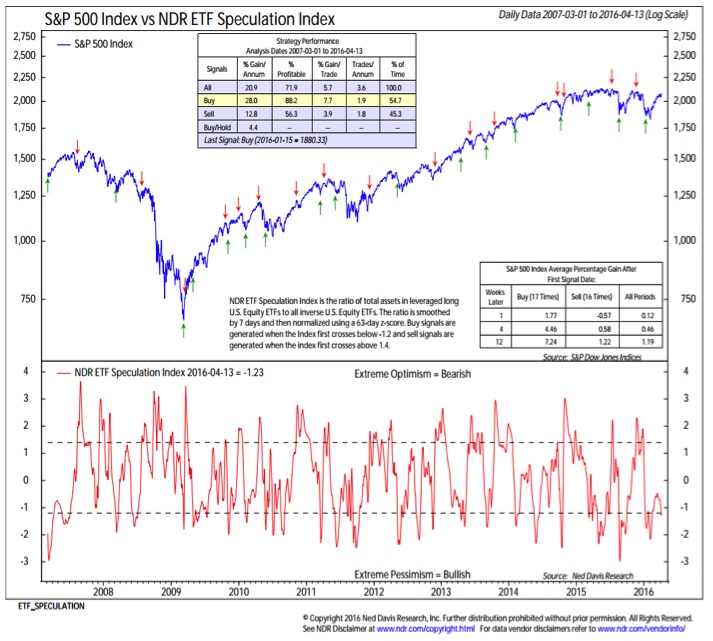
A common theme emerged in this week’s sentiment surveys. The little bit of optimism that had emerged as stocks rallied in March proved fleeting as we’ve moved into the second quarter (perhaps too much focus the well-advertised seasonal weakness that is typically seen in the second quarter of presidential election years). Both the AAII and Investors Intelligence surveys showed a decline in bulls, and the NAAIM exposure index dropped from 73% to 64%. As shown in the NDR ETF Speculation index, assets have not rotated away from inverse ETFs and toward leveraged long ETFs, further evidence that many investors/traders continue to, if not hate, at least behave skeptically toward the current stock market rally.

S&P Materials Sector
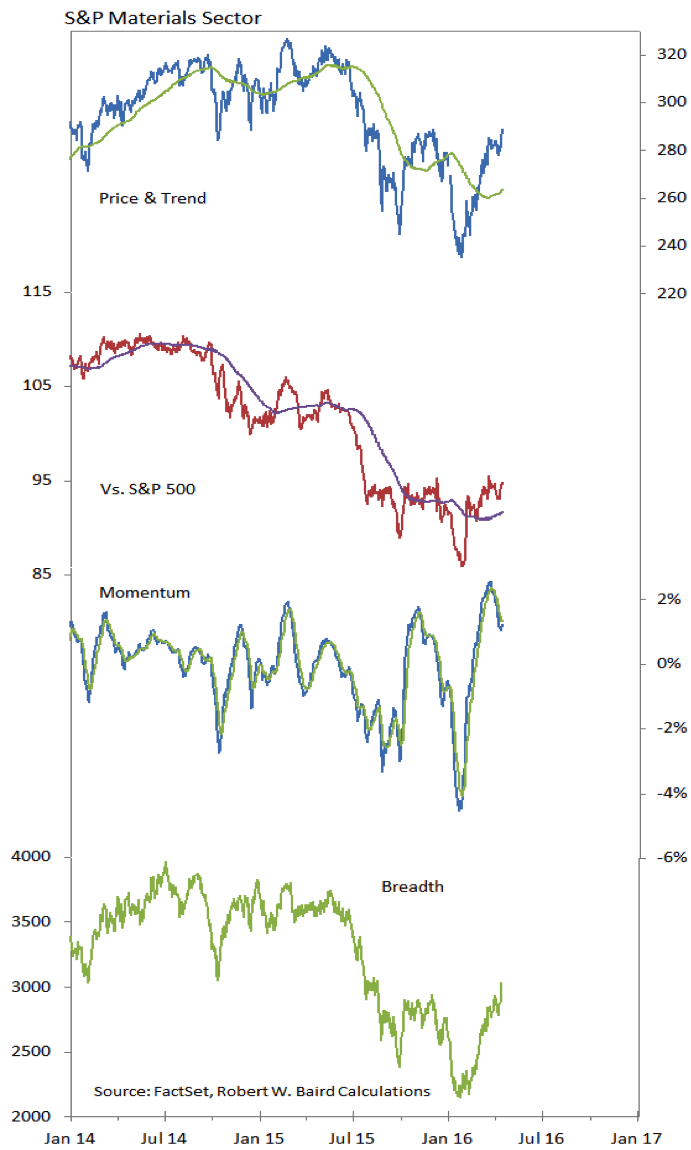
While the materials sector continues to consolidate its relative price gains, the price chart continues to improve and breadth is breaking through resistance. The move off of the lows is looking less like a counter-trend rally and more like the intial leg of a more significant up-trend. Further relative price improvement would help confirm this.
Thanks for reading this week’s stock market outlook. Have a nice weekend.
Twitter: @WillieDelwiche
Any opinions expressed herein are solely those of the author, and do not in any way represent the views or opinions of any other person or entity.


