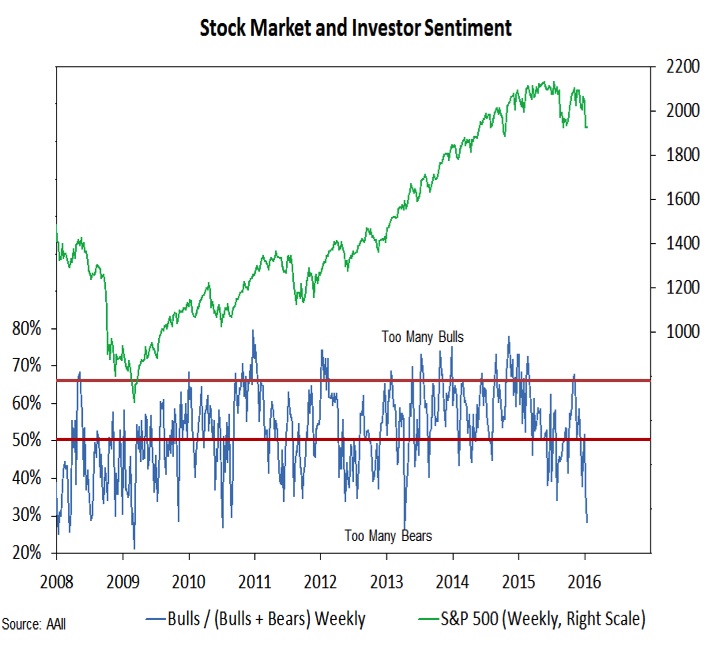
A similar story can be seen looking at the AAII survey of individual investors. This week saw bears rise from 38% to 46%, which was the highest reading since 2013. Stock market bulls declined from 22% to 18%, the lowest level since early 2005. That means we now have fewer bulls than at any time during the 2008-‘09 financial crisis.
The emergence of excessive pessimism is encouraging and could help fuel a bounce in stocks. But for a rally to be sustained we would like to see a sharp improvement in breadth trends, and better action from some of the groups that had been leaders.
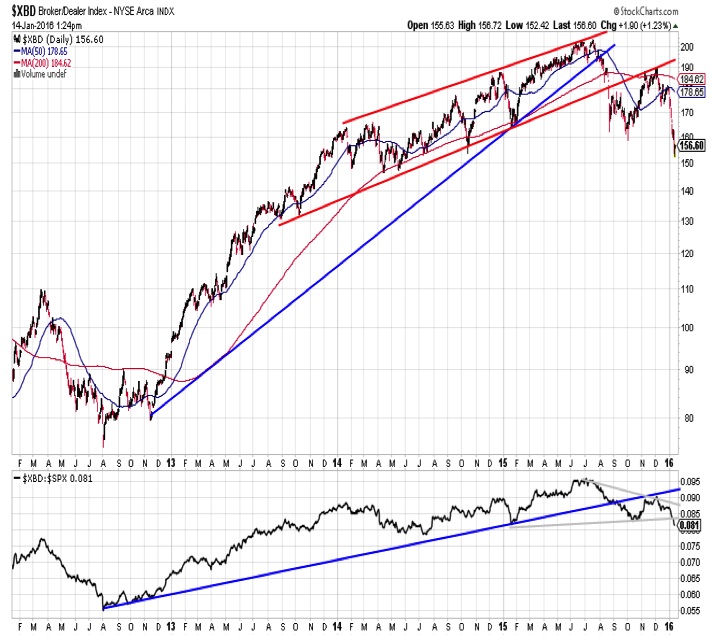
The Broker/Dealer index (shown at the right) broke below its relative price up-trend line in mid-2015 and the rally off of last year’s lows failed to carry the index above resistance at the extension of that trend line. The Broker/Dealer index has made lower highs and lower lows on both an absolute and relative price basis.
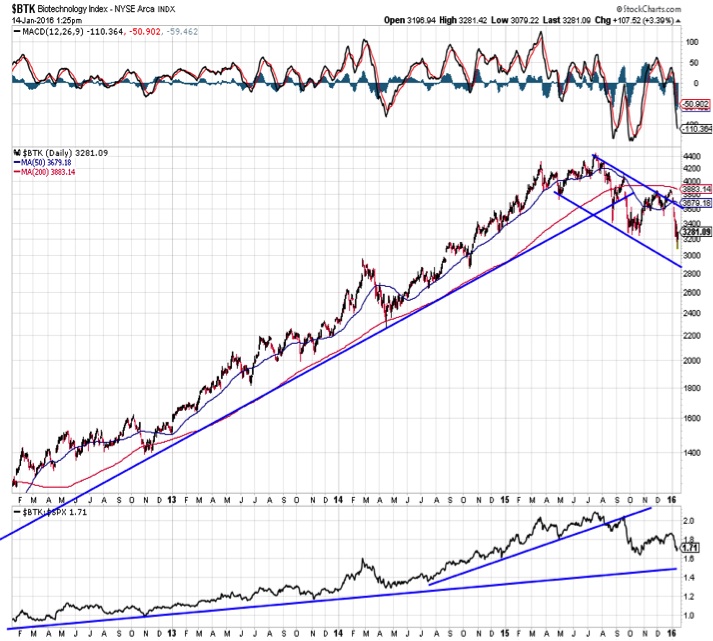
Similarly, biotechs have gone from reliable leader to laggard after failing to sustain a rally off of last year’s lows. While the longer-term relative price line has not been violated, the absolute price action (failure to rally above a well-tested trend line and a now falling 200-day average) is not indicative of strength.
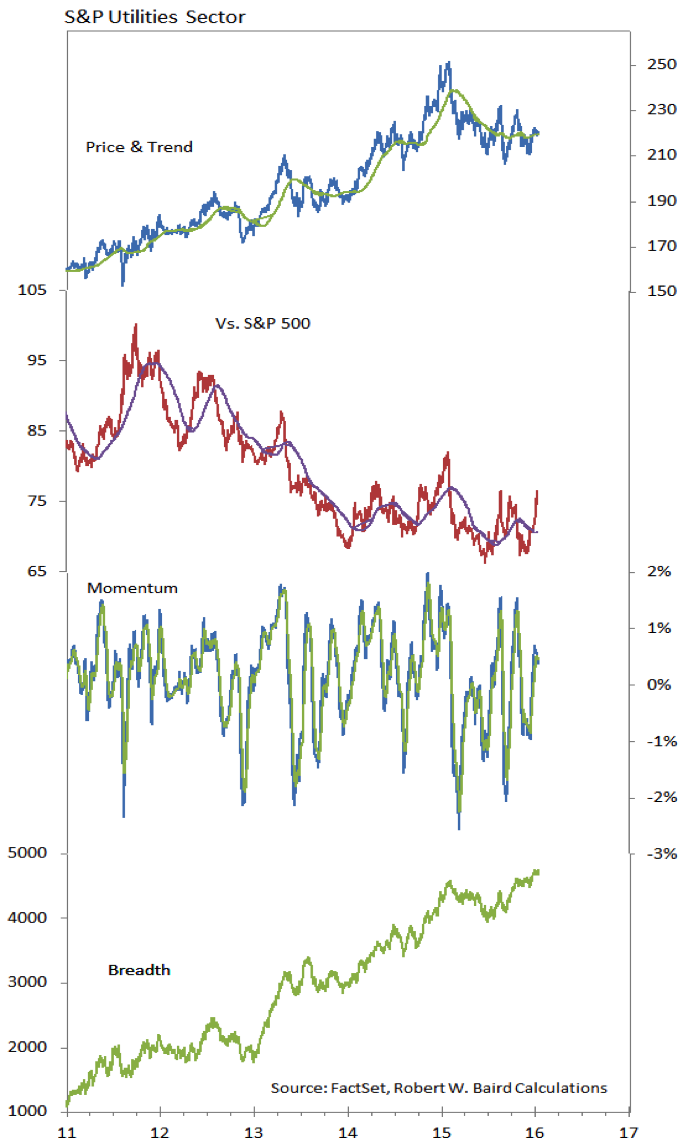
The Utilities sector is challenging a long-term relative price down-trend and is receiving support from strong sector-level breadth (at a time when breadth in the rest of the marekt is more suspect). The relative price line has now made a higher high following a higher low, which could suggests an emerging up-trend that is more than just a short-term flight to safety.
Thanks for reading.
Twitter: @WillieDelwiche
Any opinions expressed herein are solely those of the author, and do not in any way represent the views or opinions of any other person or entity.


