I’m away from home this week so today we’ll go with the short form weekend commentary with charts and some brief comments on stocks and the market. I’ll be back with a full market commentary next weekend.
The relentless rally in Russell 2000 (RUT) caused me to close my April trade this week for around the max loss. Even though we don’t like taking losses, it’s part of preserving capital to stay around and trade another day. I’m working on a recap for that trade later this week and we’ll see what we can learn. I haven’t had a chance to go through the position in detail yet so I won’t offer any thoughts at this point.
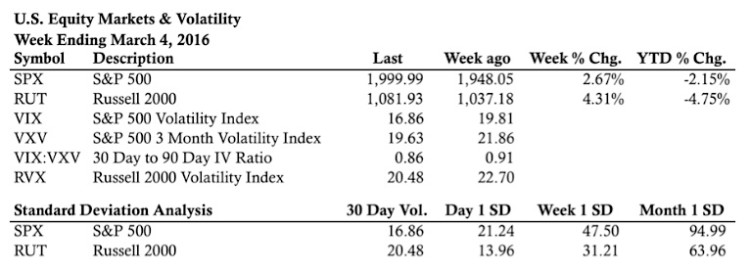
Let’s take a look at the market stats and some market volatility indicators from yet another big week for stock market bulls… a 3rd straight week of gains.
Market Stats:
Market Volatility:
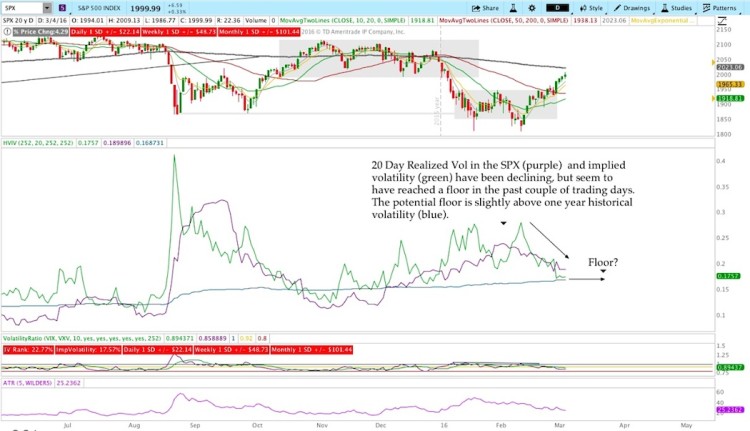
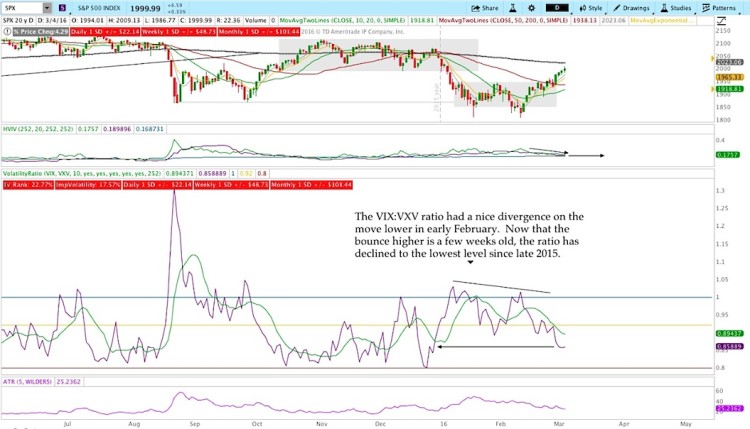
Below are charts of key stock market indices, the S&P 500 and Russell 2000. Both are pitted against key volatility indicators/ratios.
Level Of Interest:
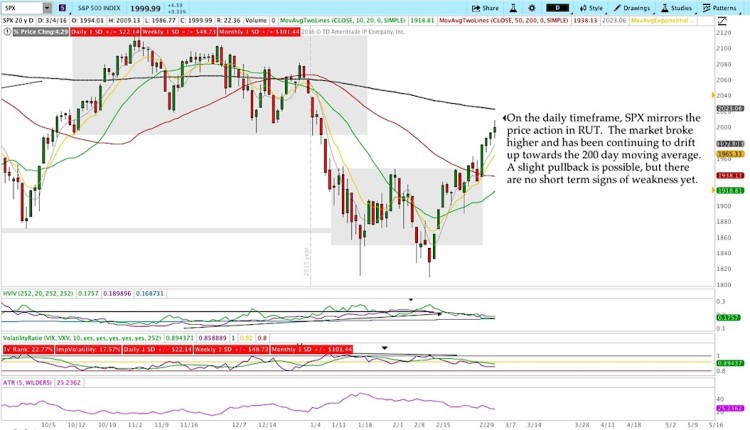
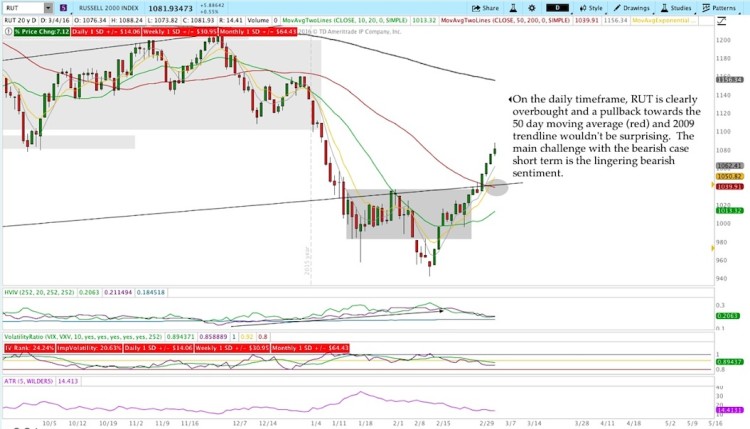
In the levels of interest section, we’ll drill down to the daily timeframe to see what’s happening in the markets. The charts below highlight some key levels to watch.
S&P 500 Index – Daily Chart
Russell 2000 Index – Daily Chart
Thanks for reading and good luck in the week ahead.
Twitter: @ThetaTrend
The author does not hold a position in any mentioned securities at the time of publication. Any opinions expressed herein are solely those of the author, and do not in any way represent the views or opinions of any other person or entity.

