 It is difficult not to notice that volatility is getting crushed today. The Volatility Index (VIX) is nearing multi-year lows, which is in line with the S&P 500 as it tries to breakout to new all-time highs (and the holiday weekend). Yet the question remains: Is this a sign of a complacent market?
Well, as the bulls and bears prepare for battle next week, and the noise index shoots higher, I thought I’d share a few random thoughts on both sides, as well as a couple of charts. Remember that time frames matter. And feel free to add to the conversation.
Complacent:
- An 11-handle on the VIX is what it is. No fear.
- New multi-year lows… the closer it gets to a 10-handle, the more worrisome (especially over the near-term, as it would be its first foray towards that level in years).
- This move lower in volatility is coming around a neutral to negative market seasonality (“Sell in May”).
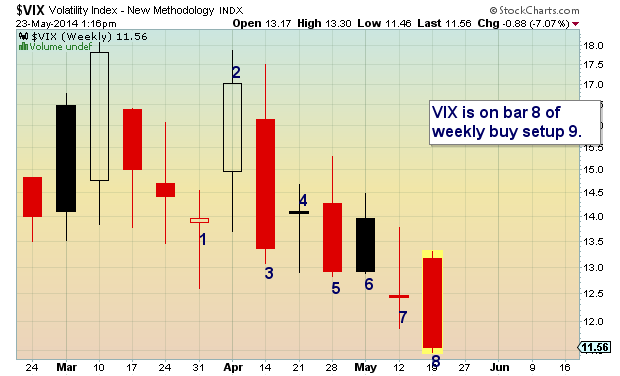
- The VIX is about to record bar 8 of a weekly buy setup (placing a high likelihood of an upside reaction in early to mid June).
Not Complacent:
- “Sell In May” shifting to “Sell In June”?
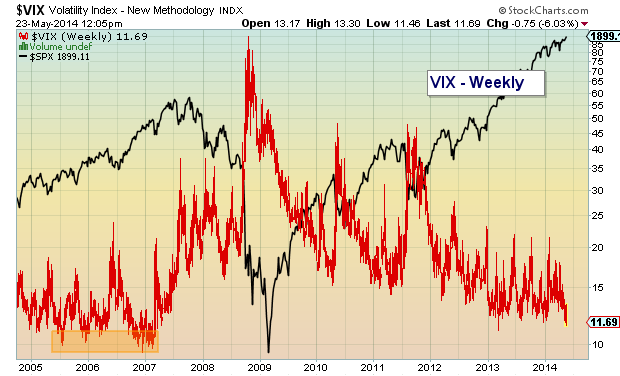
- Multi-year lows may be a near-term caution sign, but from a macro level, low volatility is a sign of more gains to come (see 2005-2006)
- Sentiment is still bearish, indicating that equities have more upside.
- “The market can remain irrational longer than you can remain solvent.” A quote attributed to John Maynard Keynes.
Note that Andrew Kassen did an excellent volatility analysis earlier this week.
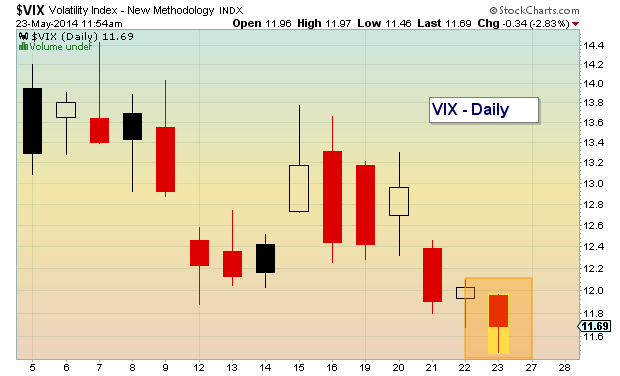
VIX – Volatility Index Daily Chart
VIX Weekly Chart (nearing buy setup)
VIX – Volatility Index Weekly Chart (vs S&P 500)
What do you think?
No position in any of the mentioned securities at the time of publication. Any opinions expressed herein are solely those of the author, and do not in any way represent the views or opinions of any other person or entity.


