The market had a rough day yesterday, with recent leadership sectors getting hit hard. The small caps (Russell 2000) was down 2.34%, while the Biotech Index was down 4.14% and the Semiconductors Index down 4.47%.
Needless to say, market volatility emerged a winner again. Considering that type of punishment, it will likely take some time to heal the internal damage (i.e. breadth).
But there have been visible warning signs that active investors shouldn’t be overextending themselves.
Note that this post went out to our email subscribers as part of our “Market Navigator” newsletter (subscribe here, it’s free).
MACRO THEMES
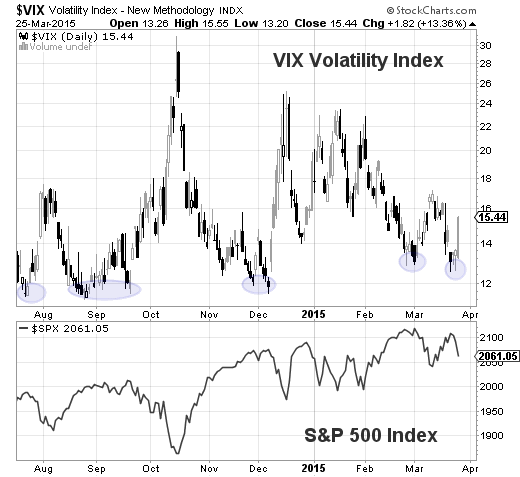
In my weekly S&P 500 update, I highlighted the risk/reward setup and several ongoing concerns. One of the biggest was a low Volatility Index (VIX) within a choppy market (translation: investor complacency while there is uncertainty in the price action).
Here are a couple stats:
- The S&P 500 have gone 26 sessions without 2 up days in a row. That’s the longest streak since 2001.
- Yesterday ended the markets string of up/down days in a row at 8.
Below is a chart of the Volatility Index vs The S&P 500. You can see how the S&P 500 rolled over near recent VIX lows over the past several months.
Volatility vs S&P 500 Chart
Here are 3 good research posts from See It Market on Small Caps & Biotech:
- Is The Russell 2000 Poised To Roll Over? by Kurt Hulse & Tom Pizzuti
- The Amazing Run In Biotech Stocks by Ben Carlson
- Biotech Sector: The Anatomy Of A Blow Off Top by Drasko Kovrlija
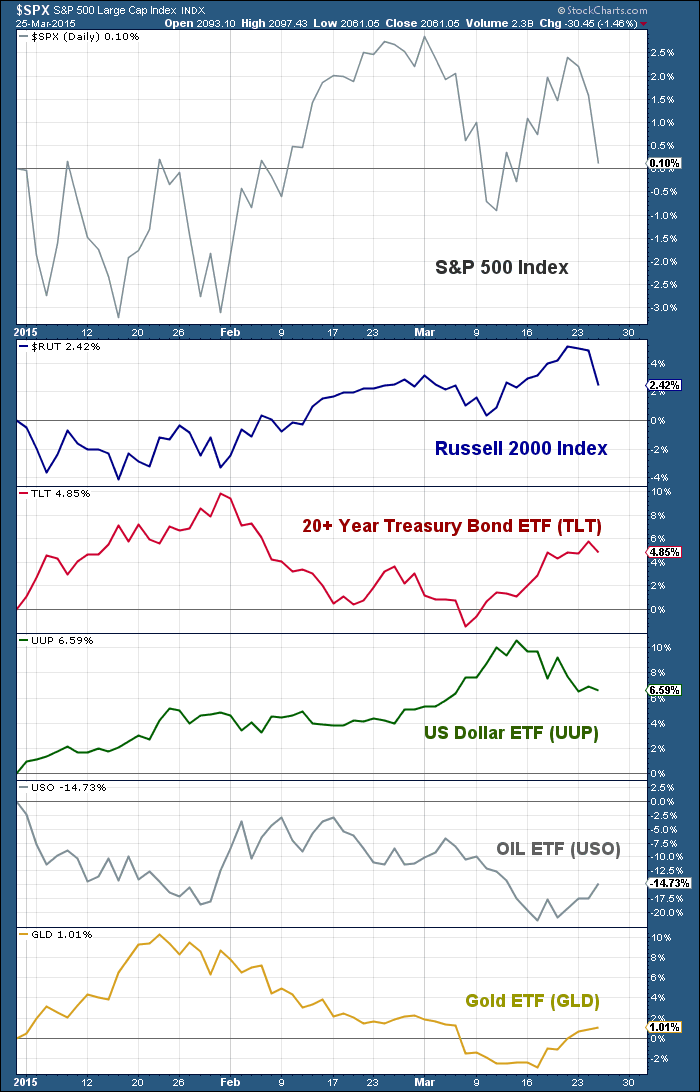
Now let’s take a look at performance across asset classes Year-To-Date. Bonds and the US Dollar are outpacing equities thus far with Gold flat and Crude Oil still down.
Market Performance Across Asset Classes
A Look Around The Globe
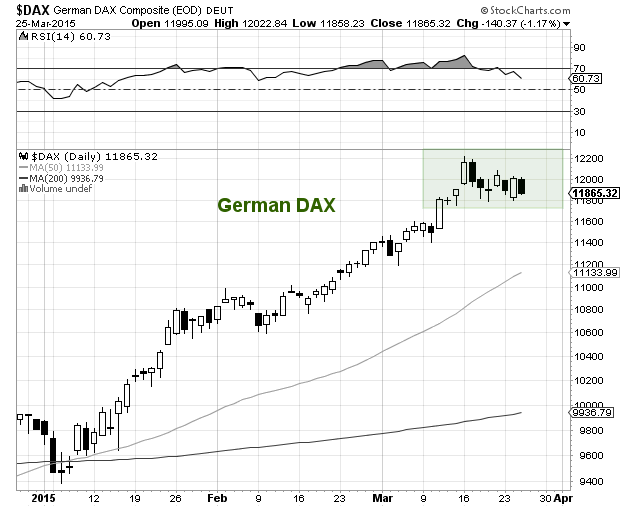
Global equities have shown some signs of wear as well. So the recent influx of volatility shouldn’t be a total surprise. The German DAX slipped as well yesterday, but closed well before the U.S. markets were done with their decline. The DAX has been a global leader of late so it should be on investors radars. It’s overbought and looking heavy (see chart below). That said, this consolidation/pullback is overdue.
German DAX CHART
NEWS & ECONOMIC CALENDAR
There’s been plenty of speculation about the Federal Reserve’s recent FOMC meeting and statement (and Janet Yellen’s press conference). The truth here is that the Fed wanted to give itself options to keep the psychology in its favor. It now has the ability to go either way and be right (i.e. credibility). It actually bought more time by removing the word patient and talking about a slow economy. Ironic.
Economic Calendar
- THURSDAY: Initial Jobless Claims, Services PMI, FOMC members Bullard and Lockhart speak.
- FRIDAY: 4th Qtr GDP, Michigan Consumer Sentiment, FOMC member Fischer speaks, as does Fed Chair Janet Yellen (in the afternoon).
Jobless claims will no doubt get some attention, but the markets will likely watch 4th Quarter GDP closely, especially since the Fed removed the word “patient” in regards to raising rates. Investors may also be curious to hear what Janet Yellen says Friday afternoon.
THE WEEK AHEAD
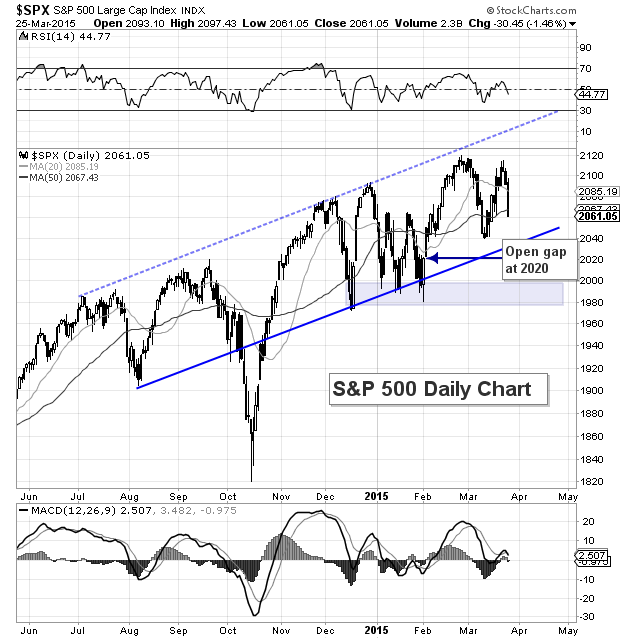
Short-term trading supports for the S&P 500 reside at 2053 (March 16 open gap), 2039 (March lows), and 2020 (February 3 open gap). A close below 2020 would put investors on notice and make the 1975-2000 support zone a must hold.
Over the weekend, I wrote about Why Bonds May Be A Market Tell this week. Well they have been. After pacing with equities for 3 weeks, the two have diverged early this week. But this relationship should be monitored in the days ahead. Trade safe and have a great rest of the week.
S&P 500 Daily Chart with support levels to watch
Follow Andy on Twitter: @andrewnyquist
Position in S&P 500 and Russell 2000 at the time of publication. Any opinions expressed herein are solely those of the author, and do not in any way represent the views or opinions of any other person or entity.


