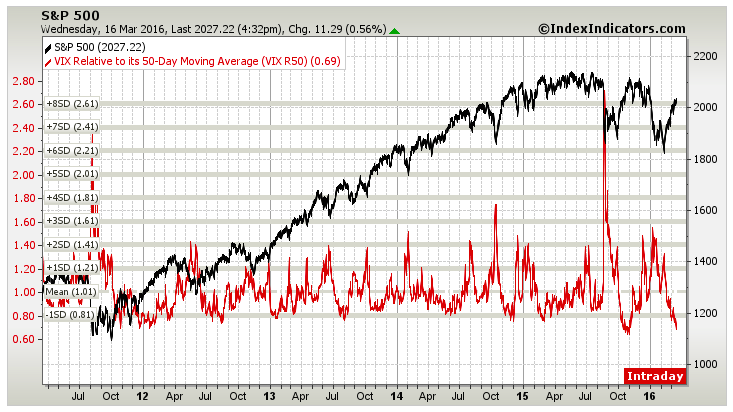
The S&P 500 has rallied over 10% since the February low, push the index up to its 50-week Moving Average. Meanwhile the Volatility Index ($VIX) has declined approx. 47%, sending the ‘fear index’ to its lowest level so far this year. Is this signaling a potential return of stock market volatility?
One way to use Moving Averages besides in terms of trend identification and areas of support and resistance is measuring how far a security or market is from its specified average price.
Currently the VIX is the furthest it’s been from its 50-day MA since the prior lower high in the S&P 500 back in October 2015. As the chart below shows, it’s now more than one standard deviation below the mean based on the distance Volatility historically travels away from its 50-day.
Previous instances of the VIX falling this quickly has led to tough market conditions in the short-term for the stock market.
As I mentioned on Twitter yesterday, the VIX is also near its 200-week Moving Average, which has been an important level in the past:
@AndrewThrasher Here is the VIX and its 200-week MA pic.twitter.com/AiPFHs6KV1
— Andrew Thrasher, CMT (@AndrewThrasher) March 16, 2016
Fellow See It Market contributor Steve Deppe also shared on Twitter that when the VIX that since 1990 when the index’s 20-day return is less than -30%, the average forward return for the S&P 500 over the next 5, 10, 20, and 40 days has been negative.
Since 1990, 121 instances where $VIX rolling 20 day return is < -30%.
Average fwd #spx returns over 5, 10, 20, and 40 days are negative.
— SJD10304 (@SJD10304) March 16, 2016
It’s important to remember that there are two ways that Volatility can correct it’s current stretched condition – time and price. We could see VIX move sideways and remain near 15, allowing its 50-day MA to ‘catch up’ or we could see a bounce sending Volatility higher. We obviously can’t know which option will occur, but it does seem that some form of mean-reversion needs to occur – whether it be via time or a large price movement. And this could affect the stock market’s quick ascent.
Thanks for reading.
The information contained in this article should not be construed as investment advice, research, or an offer to buy or sell securities. Everything written here is meant for educational and entertainment purposes only. I or my affiliates may hold positions in securities mentioned.
Further Reading From Andrew: “Can Stocks Break Above Key Price Resistance?“
Twitter: @AndrewThrasher
Read more from Andrew on his Blog.
Any opinions expressed herein are solely those of the author, and do not in any way represent the views or opinions of any other person or entity.


